
Mathematics, 29.11.2019 01:31 mathisaqeosmw
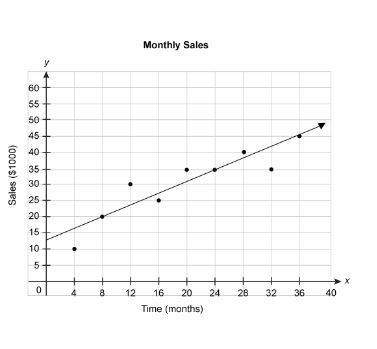
An employee compiled sales data for a company once each month. the scatter plot below shows the sales (in multiples of $1000) for the company over time (in months). the equation represents the linear model for this data.
y = 0.94x + 12.5
according to the model, how much do the company's sales increase per month?
a.$9400
b.$12,500
c$1250
d.$5000
e.$940

Answers: 3


Other questions on the subject: Mathematics
Mathematics, 21.06.2019 20:00, CelesteN64
For problems 29 - 31 the graph of a quadratic function y=ax^2 + bx + c is shown. tell whether the discriminant of ax^2 + bx + c = 0 is positive, negative, or zero.
Answers: 1
Mathematics, 21.06.2019 23:00, jayjay2006
What is the value of n in the equation -1/2(2n+4)+6=-9+4(2n+1)
Answers: 1
You know the right answer?
An employee compiled sales data for a company once each month. the scatter plot below shows the sale...
Questions in other subjects:

English, 18.03.2021 03:40

English, 18.03.2021 03:40
Mathematics, 18.03.2021 03:40
Biology, 18.03.2021 03:40

Biology, 18.03.2021 03:40


