
Mathematics, 03.10.2019 01:30 trintrin227
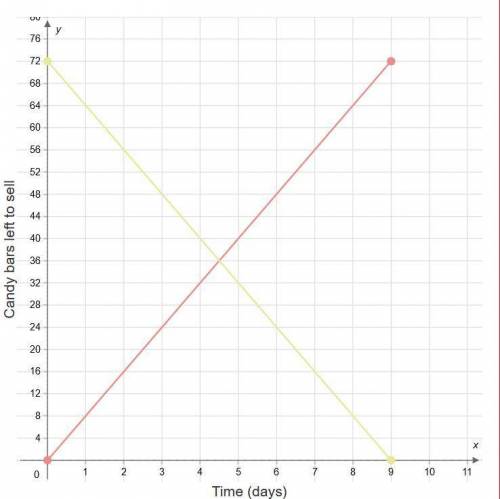
Danielle needs to sell candy bars for a club fundraiser. she starts with 72 candy bars and begins selling at a constant rate of 8 bars each day.
use the segment tool to plot a graph representing the number of candy bars danielle has left to sell from the time she begins selling until the candy bars are gone.

Answers: 1


Other questions on the subject: Mathematics
Mathematics, 21.06.2019 22:30, qveensentha59
Which of the functions below could have created this graph?
Answers: 1
You know the right answer?
Danielle needs to sell candy bars for a club fundraiser. she starts with 72 candy bars and begins se...
Questions in other subjects:

Mathematics, 18.06.2021 18:30


English, 18.06.2021 18:30


