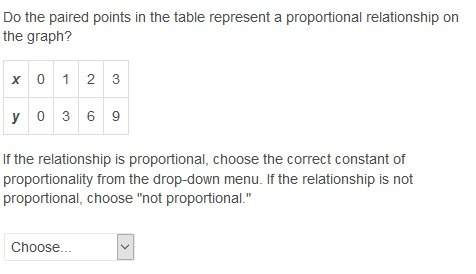
Do the paired points in the table represent a proportional relationship on the graph?
x 0 1 2...

Mathematics, 22.09.2019 00:30 paigefields2578
Do the paired points in the table represent a proportional relationship on the graph?
x 0 1 2 3
y 0 3 6 9
if the relationship is proportional, choose the correct constant of proportionality from the drop-down menu. if the relationship is not proportional, choose "not proportional."
drop down menus = 1,2,3, or not proportional

Answers: 1


Other questions on the subject: Mathematics
Mathematics, 21.06.2019 17:40, challenggirl
Find the volume of the described solid. the solid lies between planes perpendicular to the x-axis at x = 0 and x=7. the cross sectionsperpendicular to the x-axis between these planes are squares whose bases run from the parabolay=-31x to the parabola y = 30/x. a) 441b) 147c) 864d) 882
Answers: 1
Mathematics, 21.06.2019 19:30, robbiannb1399
The american academy of pediatrics wants to conduct a survey of recently graduated family practitioners to assess why they did not choose pediatrics for their specialization. provide a definition of the population, suggest a sampling frame, and indicate the appropriate sampling unit.
Answers: 3
Mathematics, 21.06.2019 21:50, kaylaamberd
Suppose that the price p, in dollars, and the number of sales, x, of a certain item follow the equation 4 p plus 4 x plus 2 pxequals56. suppose also that p and x are both functions of time, measured in days. find the rate at which x is changing when xequals2, pequals6, and startfraction dp over dt endfraction equals1.5.
Answers: 2
Mathematics, 21.06.2019 22:30, DatBoiCedd
Convert (-3,0) to polar form. a. (3,0’) b. (-3,180’) c. (3,180’) d. (3,360’)
Answers: 1
You know the right answer?
Questions in other subjects:


Biology, 11.03.2020 21:34


