The function f(x)=60(1.5)x models an animal population after x years.
how does the avera...

Mathematics, 21.10.2019 14:30 kprincess16r
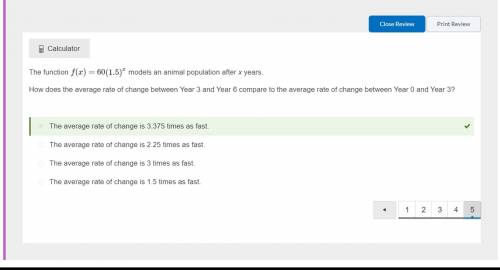
The function f(x)=60(1.5)x models an animal population after x years.
how does the average rate of change between years 3 and 6 compare to the average rate of change between years 0 and 3?
the average rate of change is 1.5 times as fast.
the average rate of change is 3 times as fast.
the average rate of change is 3.375 times as fast.
the average rate of change is 2.25 times as fast.

Answers: 3


Other questions on the subject: Mathematics
Mathematics, 21.06.2019 17:30, lizzy2951
Someone this asap for a group of students attends a basketball game. * the group buys x hot dogs at the concession stand for $2 each. * the group buys y drinks at the concession stand for $3 each. the group buys 29 items at the concession stand for a total of $70. how many hot dogs did the group buy?
Answers: 2
Mathematics, 21.06.2019 18:00, kcarstensen59070
Question: a) does the given set of points represent a linear function? how do you know? b) assume that the point (-2,4) lies on the graph of a line. what y-values could complete this set of ordered pairs that lie on the same line: (- (hint: there are several correct answ
Answers: 2
Mathematics, 21.06.2019 21:00, joshuasanders8862
You have 12 balloons to blow up for your birthday party. you blow up 1/3, and your friend blows up 5 of them. what fraction of the baloons still need blowing up
Answers: 1
Mathematics, 21.06.2019 23:30, claytonhopkins
In a study of the relationship between socio-economic class and unethical behavior, 129 university of california undergraduates at berkeley were asked to identify themselves as having low or high social-class by comparing themselves to others with the most (least) money, most (least) education, and most (least) respected jobs. they were also presented with a jar of individually wrapped candies and informed that the candies were for children in a nearby laboratory, but that they could take some if they wanted. after completing some unrelated tasks, participants reported the number of candies they had taken. it was found that those who were identiď¬ed as upper-class took more candy than others. in this study, identify: (a) the cases, (b) the variables and their types, (c) the main research question, (d) identify the population of interest and the sample in this study, and (e) comment on whether or not the results of the study can be generalized to the population, and if the ď¬ndings of the study can be used to establish causal relationships.
Answers: 2
You know the right answer?
Questions in other subjects:


