
Mathematics, 03.02.2020 15:53 elijahedgar876
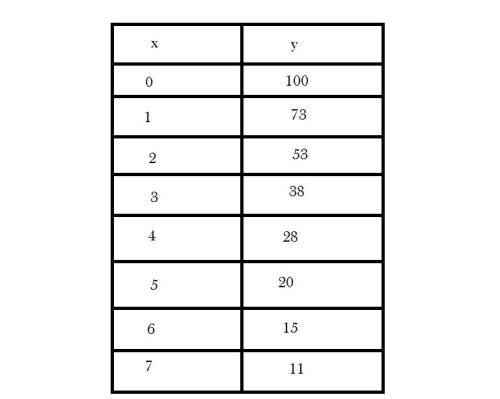
Suppose the data below are the result of a study of a medication used to fight a certain bacteria. the x column represents the number of hours after the medication was introduced to the bacteria and the y column represents the number of bacteria present. use the data in the table below to answer each question.
1. what does the scatterplot of the data show?
a. a strong positive linear relationship
b. a strong negative linear relationship
c. a curve that represents exponential growth
d. a curve that represents exponential decay
2. complete an exponential transformation on the y-values. what is the new value of y when x = 5?
a. 1.301
b. 0.699
c. 1.4472
d. 1.1761
3. find the linear transformation model.
a. log y^ (y-hat) = -12.1667x + 84.8333
b. log y^ (y-hat) = 84.8333x – 12.167
c. log y^ (y-hat) = -0.1375x + 1.9978
d. log y^ (y-hat) = 1.9978x – 0.1375
4. predict the number of bacteria present for 12 hours.
a. 0.35
b. 2.23
c. -61
d. 0

Answers: 3


Other questions on the subject: Mathematics
Mathematics, 21.06.2019 16:00, michellealvarez985
Quadrilateral wxyz is on a coordinate plane. segment yz is on the line x+y=7 and segment xw is on the line x+y=3. which statement proves how segments yz and xw are related
Answers: 1
Mathematics, 21.06.2019 20:00, brunovillarreal6576
Find the slope of the line passing through a pair of points
Answers: 2
You know the right answer?
Suppose the data below are the result of a study of a medication used to fight a certain bacteria. t...
Questions in other subjects:


