Which of the following best describes the graph shown ?
a. this is the graph of a linear funct...

Mathematics, 03.11.2019 06:31 elliebomb13
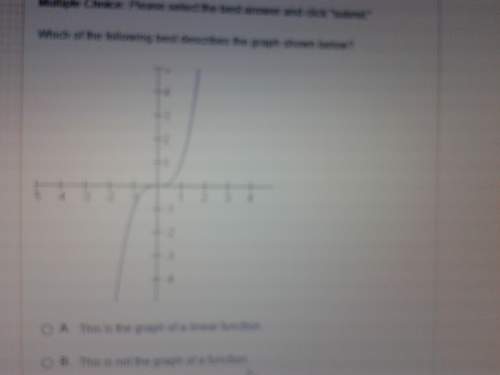
Which of the following best describes the graph shown ?
a. this is the graph of a linear function
b. this is not the graph of a function
c. this is the graph of a function but it is not one-to-one
d. this is the graph of a one-to-one function

Answers: 3


Other questions on the subject: Mathematics
Mathematics, 21.06.2019 19:00, SakChan8367
Ab based on the given diagram, if m_1 = 60° then m 2 = 30 60 90 180
Answers: 1
Mathematics, 21.06.2019 20:30, bryce59
Suppose you just purchased a digital music player and have put 8 tracks on it. after listening to them you decide that you like 4 of the songs. with the random feature on your player, each of the 8 songs is played once in random order. find the probability that among the first two songs played (a) you like both of them. would this be unusual? (b) you like neither of them. (c) you like exactly one of them. (d) redo () if a song can be replayed before all 8 songs are played.
Answers: 2
Mathematics, 21.06.2019 20:30, kingdesto3481
The function v(r)=4/3pir^3 can be used to find the volume of air inside a basketball given its radius. what does v(r) represent
Answers: 1
You know the right answer?
Questions in other subjects:
Mathematics, 04.02.2021 03:20

Chemistry, 04.02.2021 03:20
Mathematics, 04.02.2021 03:20

Chemistry, 04.02.2021 03:20

Social Studies, 04.02.2021 03:20

History, 04.02.2021 03:20


