Relationship b has a greater rate than relationship a. the graph represents relationship a.
wh...

Mathematics, 30.08.2019 22:30 blackwelle72
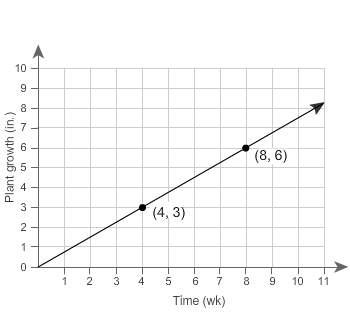
Relationship b has a greater rate than relationship a. the graph represents relationship a.
which table could represent relationship b?
first-quadrant graph showing a ray from the origin through the points 4, 3) and (8, 6). horizontal axis label is time in weeks. vertical axis label is plant growth in inches.
a.
time (weeks) 2 5 6 9
plant growth (in.) 1.2 3 3.6 5.4
b.
time (weeks) 2 5 6 9
plant growth (in.) 1.4 3.5 4.2 6.3
c.
time (weeks) 2 5 6 9
plant growth (in.) 1.6 4 4.8 7.2
d.
time (weeks) 3 4 6 9
plant growth (in.) 1.5 2 3 4.5

Answers: 1


Other questions on the subject: Mathematics
Mathematics, 21.06.2019 18:30, leobaut6145
Apsychology student wishes to investigate differences in political opinions between business majors and political science majors at her college. she randomly selects 100 students from the 260 business majors and 100 students from the 180 political science majors. does this sampling plan result in a simple random sample? why or why not? no, because each group of 200 students in the sample does not have the same chance of being selected. yes, because each group of 200 students in the sample has the same chance of being selected. no, because each individual student does not have an equal chance of being selected. yes, because each individual student has the same chance of being selected.
Answers: 1
Mathematics, 21.06.2019 19:30, fraven1819
:24% of students in a class are girls. if there are less than 30 students in this class, how many students are there? how many girls are there?
Answers: 2
Mathematics, 21.06.2019 20:30, nsbegay2007
Tom is the deli manager at a grocery store. he needs to schedule employee to staff the deli department for no more that 260 person-hours per week. tom has one part-time employee who works 20 person-hours per week. each full-time employee works 40 person-hours per week. write and inequality to determine n, the number of full-time employees tom may schedule, so that his employees work on more than 260 person-hours per week. graph the solution set to this inequality.
Answers: 2
You know the right answer?
Questions in other subjects:
Mathematics, 23.10.2021 17:30
Mathematics, 23.10.2021 17:30

Chemistry, 23.10.2021 17:30
Mathematics, 23.10.2021 17:30

Social Studies, 23.10.2021 17:30

English, 23.10.2021 17:30
Mathematics, 23.10.2021 17:30
Mathematics, 23.10.2021 17:30
English, 23.10.2021 17:30


