
Mathematics, 26.08.2019 10:10 cyaransteenberg
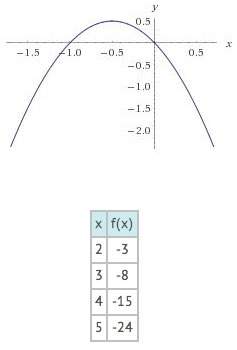
Compare the function represented by the table to the function represented by the graph to determine which statement is true.
a) the tabled function has a lessor minimum value.
b) the tabled function has a greater maximum value.
c) the graphed function has a lessor minimum value.
d) the graphed function has a greater maximum value.

Answers: 2


Other questions on the subject: Mathematics
Mathematics, 21.06.2019 18:30, mauralawson
Aball is thrown from a height of 139 feet with an initial downward velocity of 15 ft/s. the ball's height h (in feet) after t seconds is given by the following. h=139-15t-16t^2 how long after the ball is thrown does it hit the ground? round your answer(s) to the nearest hundredth. (if there is more than one answer, use the "or" button.) t =
Answers: 1
Mathematics, 21.06.2019 22:40, alialoydd11
Afunction g(x) has x-intercepts at (, 0) and (6, 0). which could be g(x)? g(x) = 2(x + 1)(x + 6) g(x) = (x – 6)(2x – 1) g(x) = 2(x – 2)(x – 6) g(x) = (x + 6)(x + 2)
Answers: 1
Mathematics, 22.06.2019 01:50, Aidanme25
If its non of them tell me..valerie took a day-trip. she drove from her house for a while and took a coffee break. after her coffee break, she continued driving. after 2 hours of driving after her coffee break, her distance from her house was 210 miles. her average speed during the whole trip was 60 miles per hour. valerie created the equation y−210=60(x−2) to represent this situation, where xx represents the time in hours from her coffee break and yy represents the distance in miles from her house. which graph correctly represents valerie's distance from her house after her coffee break?
Answers: 1
You know the right answer?
Compare the function represented by the table to the function represented by the graph to determine...
Questions in other subjects:
Mathematics, 24.08.2021 01:20


Geography, 24.08.2021 01:20
Mathematics, 24.08.2021 01:20

Mathematics, 24.08.2021 01:20


