
Mathematics, 29.08.2019 20:00 ShundaBaker
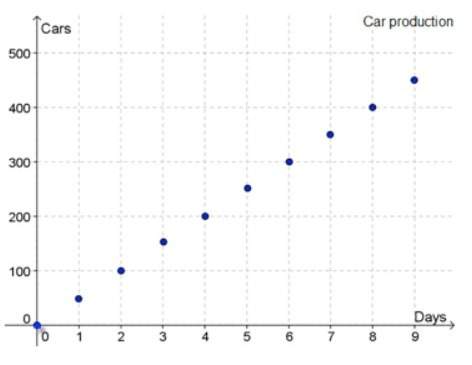
The graph shows the production of cars per day at a factory during a certain period of time. what is the domain of this function during this period?
the domain is all real numbers 0 through 9.
the domain is all integers 0 through 9.
the domain is all positive real numbers.
the domain is all positive integers.

Answers: 1


Other questions on the subject: Mathematics
Mathematics, 21.06.2019 18:30, andrewblack033
In the following diagram it is given that dec, ab || dc, ad || eb, and ad is congruent to bc. a)why isn't abc a parallelogram even though it has a pair of parallel sides and a pair of congruent sides b)explain why be must be congruent to bc. further explain what type of triangle this makes triangle abc and what it tells you about angle 1 and angle 2c) finally why must angle 3 be congruent to angle 1? further, explain why we know that angle 3 is congruent to angle 2
Answers: 1
Mathematics, 21.06.2019 20:10, jessixa897192
Complete the solution of the equation. find the value of y when x equals -5. -4x - 8y = -52
Answers: 2
Mathematics, 21.06.2019 22:30, blackordermember
Which description is represented by a discrete graph? kiley bought a platter for $19 and several matching bowls that were $8 each. what is the total cost before tax? the temperature at 9 a. m. was 83° f and is heating up at an average rate of 6°f per hour. what is the temperature x hours later? juan ate an egg with 78 calories and some cereal with 110 calories per serving for breakfast. what is the total amount of calories he consumed? a bottle contained 2,000 ml of liquid and is being poured out at an average rate of 300 ml per second. how much liquid is left in the bottle after x seconds?
Answers: 3
You know the right answer?
The graph shows the production of cars per day at a factory during a certain period of time. what is...
Questions in other subjects:


Arts, 01.04.2020 07:02


History, 01.04.2020 07:03
Mathematics, 01.04.2020 07:03

Mathematics, 01.04.2020 07:03

English, 01.04.2020 07:03
Mathematics, 01.04.2020 07:03


