
Mathematics, 20.10.2019 17:00 kinglightskin2k
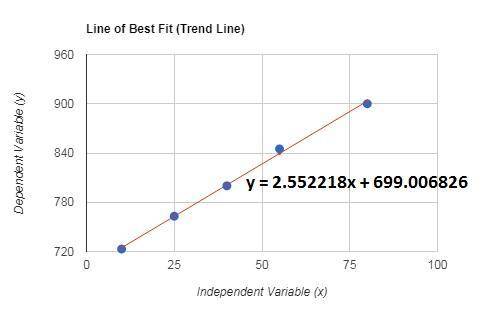
1) the data in the table below represents the pressure of the gas as the temperature changes. plot a graph of the data, using the space below. draw a trend line and calculate its slope. how are the variables related? what will he pressure of the gas be at 0c?
the graph looks like this
temperature pressure
10 723
25 763
40 800
55 845
80 900

Answers: 1


Other questions on the subject: Mathematics
Mathematics, 21.06.2019 13:00, vlactawhalm29
Remmi wrote the equation of the line y=⅓(x+2) he solved for x and got x=3y-2 which of the following is an equivalent equation for x? a. x=y-11/3 b. x=y+7/3 c. x=3(y-⅔) d. x=3(y+⅔)
Answers: 1
Mathematics, 21.06.2019 19:00, kaylaamberd
What is the expression in factored form? -x^2 + 3x + 28 a. (x-7)(x-4) b. -(x-7)(x+4) c. (x+4)(x+7) d. -(x-4)(x+7)
Answers: 2
Mathematics, 21.06.2019 22:00, mollybeale
Luke wants to reduce the area of his rectangular garden by 1/4 the expression 14/w can be used to represent this change. what is another way to write this expression?
Answers: 1
Mathematics, 22.06.2019 04:00, rebeccamckellpidge
Its due 1. what is the product of 1/2-1/4? write your answer in standard form. a) show your work. b) is the product of 1/2x-1/4 and 5x^2-2x+6 equal to product of 1/4x-1/2 and 5x^2-2x+6? explain your answer.
Answers: 1
You know the right answer?
1) the data in the table below represents the pressure of the gas as the temperature changes. plot a...
Questions in other subjects:

History, 07.10.2019 05:00
History, 07.10.2019 05:00

English, 07.10.2019 05:00

Chemistry, 07.10.2019 05:00
English, 07.10.2019 05:00

Health, 07.10.2019 05:00


