
Mathematics, 27.08.2019 08:30 savannahvargas512
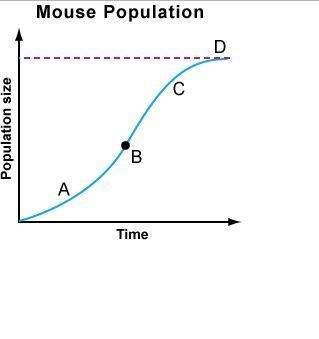
"the graph below shows the population of mice in an ecosystem where the mice are not allowed to enter or leave.
which best describes the population at point a?
a. the death rate is higher than the birthrate.
b. the population is decreasing.
c. the birthrate is higher than the death rate.
d. it has reached carrying capacity"

Answers: 2


Other questions on the subject: Mathematics
Mathematics, 22.06.2019 01:00, sebastiantroysmith
What is the slope of the line? a. -5/2 b.2/5 c. 5/2 d.7/2
Answers: 1
You know the right answer?
"the graph below shows the population of mice in an ecosystem where the mice are not allowed to ente...
Questions in other subjects:

Biology, 30.10.2020 16:50


Health, 30.10.2020 16:50
Mathematics, 30.10.2020 16:50
Mathematics, 30.10.2020 16:50


