What is the most misleading aspect of this graph that might lead one to the wrong conclusion?
...

Mathematics, 13.10.2019 05:01 feefee945
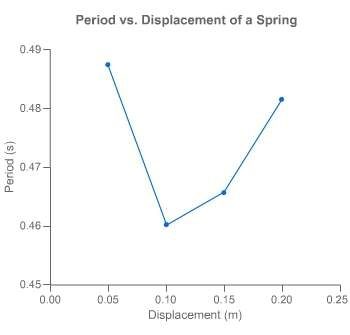
What is the most misleading aspect of this graph that might lead one to the wrong conclusion?
connecting the data points with a line
scale of the y-axis
scale of the x-axis
spacing of the grid
(graph attached)

Answers: 3


Other questions on the subject: Mathematics
Mathematics, 21.06.2019 14:30, Carrchris021
Because of your favorite lemonade it is $3.84 for 3 gallons. write this as an unit rate
Answers: 2
Mathematics, 21.06.2019 20:50, peachijmin
These tables represent a quadratic function with a vertex at (0, -1). what is the average rate of change for the interval from x = 9 to x = 10?
Answers: 2
You know the right answer?
Questions in other subjects:

Arts, 03.02.2021 01:00
Mathematics, 03.02.2021 01:00
Mathematics, 03.02.2021 01:00
Mathematics, 03.02.2021 01:00

Mathematics, 03.02.2021 01:00
History, 03.02.2021 01:00

Business, 03.02.2021 01:00


