What was the cyclist average speed during the
time represented on the graph?
1. 10 KM/H...

Mathematics, 19.04.2021 20:50 gbprulesmile
What was the cyclist average speed during the
time represented on the graph?
1. 10 KM/H
2. 20 KM/H
3. 30 KM/H
4. 40 KM/H
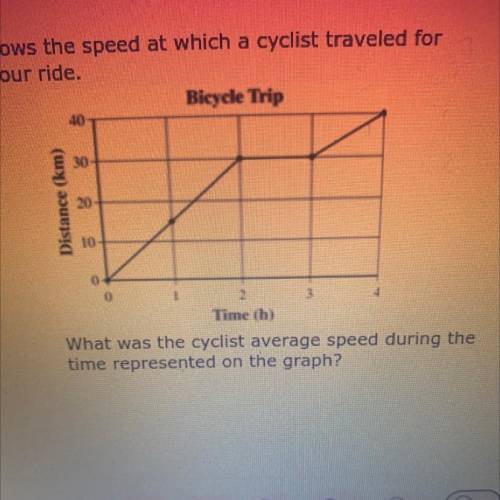

Answers: 3


Other questions on the subject: Mathematics
Mathematics, 21.06.2019 13:00, onegirl435
Find the value of the variable and the length of each secant segment.
Answers: 2
Mathematics, 21.06.2019 19:00, hbstanley3
You and a friend went to the movies. you spent half your money on tickets. then you spent 1/4 of the money on popcorn, $2 on candy, and $3 on a soda. if you have $1 left, hiw much money did u take to the movies?
Answers: 1
Mathematics, 21.06.2019 23:30, mem8163
Graham’s monthly bank statement showed the following deposits and withdrawals. -$25.20, $42.75, -$22.04, -$18.50, $74.11. part a if grahams baldness in the account was $37.86 at the beginning of the month,! 27/4! 2// the account balance at the end of the month? ? plz i will give you 100 points
Answers: 1
You know the right answer?
Questions in other subjects:

Geography, 16.10.2019 10:30

Biology, 16.10.2019 10:30


History, 16.10.2019 10:30
Mathematics, 16.10.2019 10:30

Computers and Technology, 16.10.2019 10:30
Geography, 16.10.2019 10:30
English, 16.10.2019 10:30


