
Mathematics, 19.04.2021 19:50 b00n4l1f3
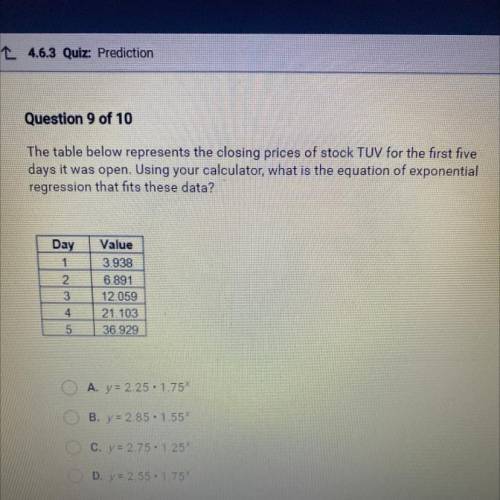
The table below represents the closing prices of stock TUV for the first five
days it was open. Using your calculator, what is the equation of exponential
regression that fits these data?
Day
1
2
3
WN
Value
3.938
6.891
12.059
21.103
36.929
4
5
A. y = 2.25. 1.75%
B. y = 2.85.1.55%
C. y = 2.75 1.25%
D. y = 2.55.175

Answers: 3


Other questions on the subject: Mathematics
Mathematics, 21.06.2019 14:40, nuggetslices
Write the sentence as an equation. 6 fewer than the quantity 140 times j equals 104
Answers: 2
Mathematics, 21.06.2019 20:20, rleiphart1
Which of the following values are in the range of the function graphed below? check all that apply ! - will give the answer "brainliest! "
Answers: 1
Mathematics, 21.06.2019 22:10, BilliePaul95
Ellen makes and sells bookmarks. she graphs the number of bookmarks sold compared to the total money earned. why is the rate of change for the function graphed to the left?
Answers: 1
You know the right answer?
The table below represents the closing prices of stock TUV for the first five
days it was open. Us...
Questions in other subjects:


Health, 12.08.2020 08:01
Mathematics, 12.08.2020 08:01


