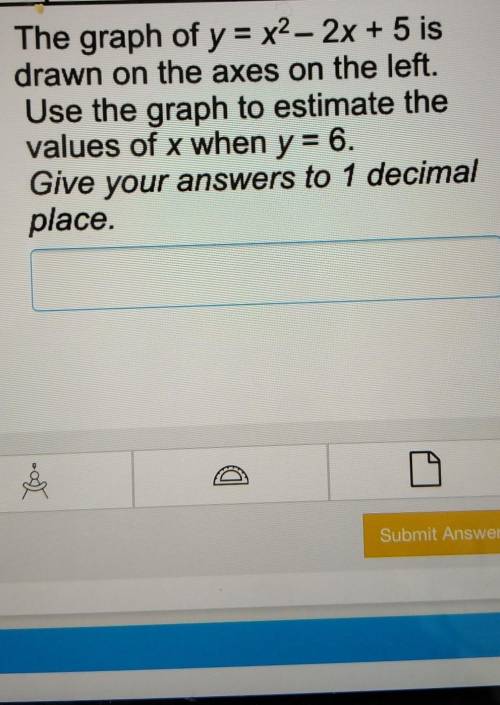
B) The graph of y = x^2–2x + 5 is
drawn on the axes on the left.
Use the graph to estimate the...

Mathematics, 17.04.2021 18:10 toni240
B) The graph of y = x^2–2x + 5 is
drawn on the axes on the left.
Use the graph to estimate the
values of x when y = 6.
Give your answers to 1 decimal
place.


Answers: 1


Other questions on the subject: Mathematics

Mathematics, 21.06.2019 17:10, jonathan3191
Empty box + box + empty box fill in the box is equal to 30 how
Answers: 2

Mathematics, 21.06.2019 18:50, karen718
Abag contains 4 red, 7 blue and 5 yellow marbles. event a is defined as drawing a yellow marble on the first draw and event b is defined as drawing a blue marble on the second draw. if two marbles are drawn from the bag, one after the other and not replaced, what is p(b|a) expressed in simplest form? a. 7/16 b. 7/15 c. 14/16 d. 14/15
Answers: 1

Mathematics, 21.06.2019 21:00, joshuasanders8862
You have 12 balloons to blow up for your birthday party. you blow up 1/3, and your friend blows up 5 of them. what fraction of the baloons still need blowing up
Answers: 1
You know the right answer?
Questions in other subjects:


Chemistry, 21.04.2021 23:50


Mathematics, 21.04.2021 23:50


History, 21.04.2021 23:50


Mathematics, 21.04.2021 23:50


