
Mathematics, 17.04.2021 09:10 aangishah8452
MacroEconomics
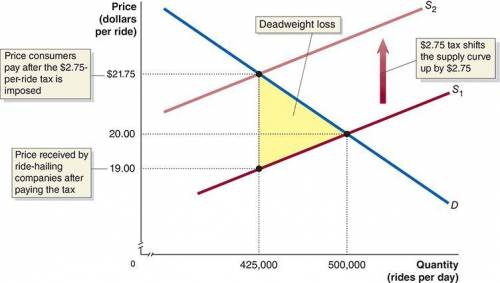
The market for ride-hailing services before and after the imposition of a $2.75-per-ride tax shows that the tax shifts the supply curve up by $2.75, increasing the price paid by the consumer from $20 to $21.75 and decreasing the price received by ride-hailing companies from $20 to $19. The quantity of rides provided also falls from 500,000 to 425,000.
On the truncated graph, the X axis represents quantity in rides per day, and the Y axis represents price in dollars per ride. $21.75 is the price consumers pay after the $2.75 per ride tax is imposed, and 19.00 is the price received by ride hailing companies after paying the tax. The supply line S sub 1 rises through the points (425,000, 19.00), and (500,000, 20,00). It shifts up when the $2.75 tax shifts the supply curve up by $2.75, and becomes line S sub 2. S sub 2 passes through the point (425,000, 21.75). The demand line falls through the supply lines through points (425,000, 21.75) and (500,000, 20.00). The triangular space in the interior angle of S sub 1 and D is in yellow, and represents deadweight loss.
Thinking Critically
1.The figure shows the market for rides before and after the imposition of a $2.75-per-ride tax. How can we use the figure to measure the effect the tax has on consumers and on Uber and Lyft? Redraw the graph and show the areas representing the losses to consumers and to firms resulting from the implementation of the tax.
2. In New York City, drivers for ride-hailing services are now guaranteed a minimum wage. Draw a graph to show the economic effect of this price floor in the market for these drivers. On the graph, identify the minimum wage, the deadweight loss, and the number of surplus drivers that result from the minimum wage.
I already answered the questions but I need help with the graphs as I always mess up somehow.

Answers: 2


Other questions on the subject: Mathematics
Mathematics, 21.06.2019 16:50, charlotte67
Which of the following points is collinear with (-2,1) and (0,3)
Answers: 3
Mathematics, 21.06.2019 17:30, zylovesnesha
If jaime wants to find 60% of 320, which table should he use?
Answers: 1
You know the right answer?
MacroEconomics
The market for ride-hailing services before and after the imposition of a $2.75-per-...
Questions in other subjects:

History, 30.07.2019 01:30


Business, 30.07.2019 01:30
Biology, 30.07.2019 01:30

Social Studies, 30.07.2019 01:30
Biology, 30.07.2019 01:30


