
Mathematics, 16.04.2021 22:20 jdiel14
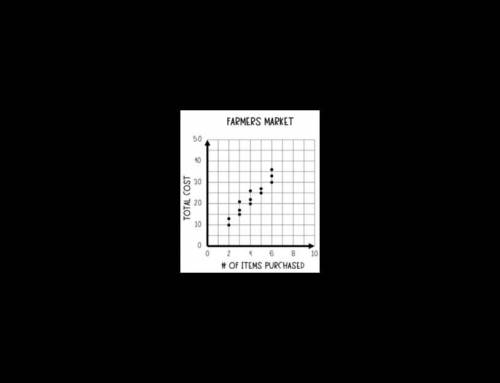
The graph below shows the number of items purchased and the total cost that 13 people spent at the farmers market. Based on the data shown, which of the following is the best prediction for the number of items purchased if they spent a total cost of $45?
A. 6
B. 7
C. 9
D. 10

Answers: 2


Other questions on the subject: Mathematics
Mathematics, 21.06.2019 21:50, libi052207
Free points also plz look my profile and answer really stuff
Answers: 2
Mathematics, 21.06.2019 22:30, fredvales19
What fraction is equivalent to 0.46464646··· a. 46⁄99 b. 46⁄999 c. 46⁄100 d. 23⁄50
Answers: 1
Mathematics, 21.06.2019 22:50, Yangster9305
Ur environment is very sensitive to the amount of ozone in the upper atmosphere. the level of ozone normally found is 4.04.0 parts/million (ppm). a researcher believes that the current ozone level is not at a normal level. the mean of 2525 samples is 4.44.4 ppm with a standard deviation of 0.80.8. assume the population is normally distributed. a level of significance of 0.020.02 will be used. make the decision to reject or fail to reject the null hypothesis. answer tables
Answers: 3
You know the right answer?
The graph below shows the number of items purchased and the total cost that 13 people spent at the f...
Questions in other subjects:

History, 01.12.2021 06:00
Mathematics, 01.12.2021 06:00

English, 01.12.2021 06:00
Mathematics, 01.12.2021 06:00


Mathematics, 01.12.2021 06:00


