37
Entry Ticket
The dot plot shows the number of touchdowns a football team scored in 10 game...

Mathematics, 16.04.2021 22:20 mikisims
37
Entry Ticket
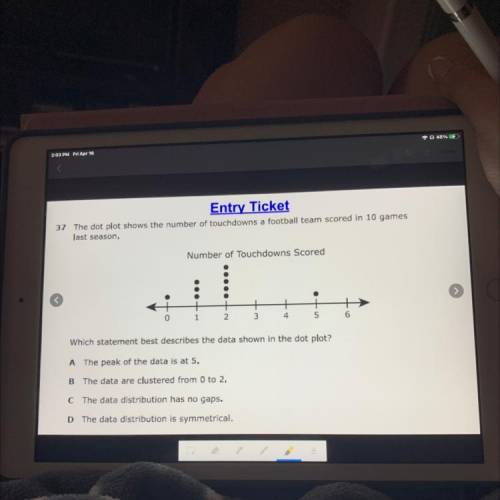
The dot plot shows the number of touchdowns a football team scored in 10 games
last season,
Number of Touchdowns Scored
0
1
2.
3
4
5
6
Which statement best describes the data shown in the dot plot?
A The peak of the data is at 5.
B The data are clustered from 0 to 2,
C The data distribution has no gaps.
D The data distribution is symmetrical.

Answers: 1


Other questions on the subject: Mathematics
Mathematics, 21.06.2019 17:00, uuuugggghhhh2463
At the beginning of the day, stock xyz opened at $6.12. at the end of the day, it closed at $6.88. what is the rate of change of stock xyz? a. 1.17% b. 11.0% c. 12.4% d. 81.5%
Answers: 1
Mathematics, 21.06.2019 20:00, allycoops666666
Sarah took the advertising department from her company on a round trip to meet with a potential client. including sarah a total of 11 people took the trip. she was able to purchase coach tickets for $280 and first class tickets for $1280. she used her total budget for airfare for the trip, which was $6080. how many first class tickets did she buy? how many coach tickets did she buy?
Answers: 1
Mathematics, 21.06.2019 23:00, utjfkdndidndldn62121
Why is it so easy to buy on impulse and overspend with a credit card? what could you do to counteract this tendency?
Answers: 1
You know the right answer?
Questions in other subjects:
Mathematics, 04.06.2021 16:00

Spanish, 04.06.2021 16:00

History, 04.06.2021 16:00

Mathematics, 04.06.2021 16:00
Mathematics, 04.06.2021 16:00


