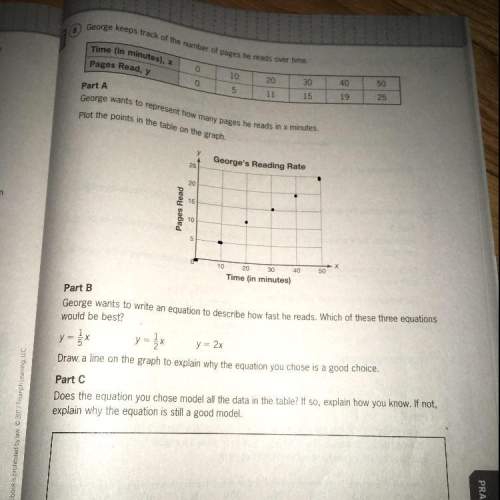
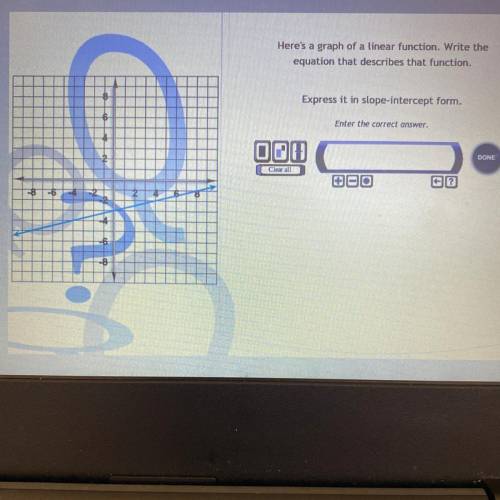
Here's a graph of a linear function. Write the
equation that describes that function.
Express...

Mathematics, 16.04.2021 20:40 loveuncondition
Here's a graph of a linear function. Write the
equation that describes that function.
Express it in slope-intercept form.
Enter the correct answer.

Answers: 2


Other questions on the subject: Mathematics
Mathematics, 21.06.2019 16:10, lilyplant4289
The number of hours per week that the television is turned on is determined for each family in a sample. the mean of the data is 37 hours and the median is 33.2 hours. twenty-four of the families in the sample turned on the television for 22 hours or less for the week. the 13th percentile of the data is 22 hours. approximately how many families are in the sample? round your answer to the nearest integer.
Answers: 1
Mathematics, 21.06.2019 20:00, cielo2761
The table below represents a linear function f(x) and the equation represents a function g(x): x f(x) −1 −5 0 −1 1 3 g(x) g(x) = 2x − 7 part a: write a sentence to compare the slope of the two functions and show the steps you used to determine the slope of f(x) and g(x). (6 points) part b: which function has a greater y-intercept? justify your answer. (4 points)
Answers: 2
Mathematics, 22.06.2019 01:30, charliiboddie29
Based on the diagrams, what is the value of x?
Answers: 1
You know the right answer?
Questions in other subjects:

Mathematics, 22.06.2019 07:00

English, 22.06.2019 07:00


History, 22.06.2019 07:00


