
Mathematics, 16.04.2021 18:40 kelsey152
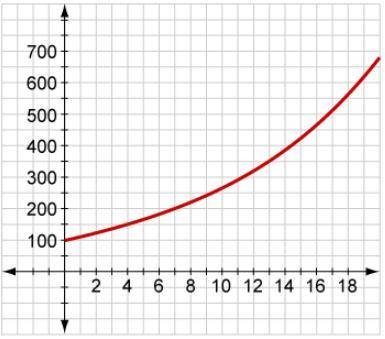
Which of the following scenarios is the best fit for the graph?
A. The value of a $100 stock grows in value by 10% each year.
B. The batting average of a baseball team increases by 50 points each year.
C. The population of a small town decreases by 10% each year.
D. A class's percent correct on a standardized Algebra I test increases after using a new software program.

Answers: 3


Other questions on the subject: Mathematics
Mathematics, 21.06.2019 16:30, xxaurorabluexx
If g(x) is an odd function, which function must be an even function?
Answers: 3
Mathematics, 21.06.2019 21:30, EinsteinBro
Ijust need these 2 questions answered (the second pic is just confirmation i'm not confident in that answer)
Answers: 1
Mathematics, 22.06.2019 00:40, seiglersteven99
Ican interpret and represent the remainder in division calculations sensibly for the context (eg 27.4 in calculating average height in cm: $27.44 if it represents an amount of money) solve the following problems. 15) the wildlife park charges $25.50 dollars per person to enter their park if the park made $15096 dollars today, how many people entered the park? 16) ms adams plus 2,230 other keen runners ran a marathon: between them they ran 94817.5km. how many km did each competitor run?
Answers: 1
Mathematics, 22.06.2019 01:00, yselahernandez02
Suppose the equation ||x-a|-b|=2008 has 3 distinct real roots and a not =0. find the value of b.
Answers: 1
You know the right answer?
Which of the following scenarios is the best fit for the graph?
A. The value of a $100 stock grows...
Questions in other subjects:


Mathematics, 29.07.2019 02:30
Mathematics, 29.07.2019 02:30
English, 29.07.2019 02:30
Mathematics, 29.07.2019 02:30

Mathematics, 29.07.2019 02:30


