
Mathematics, 15.04.2021 21:20 highschoolkid621
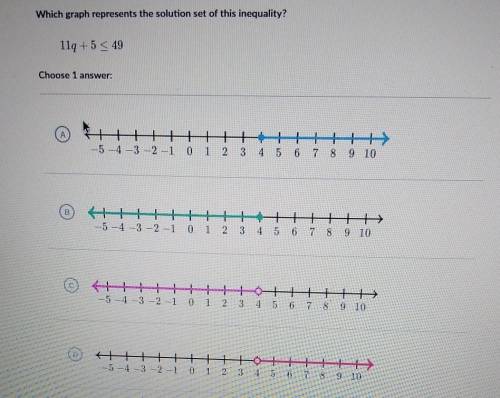
Which graph represents the solution set of this inequality? 119 +5< 49 Choose 1 {+ -5 -4 -3 -2 -1 0 1 2 3 4 5 6 7 8 9 10 -5-4-3-2-1 0 1 2 3 4 5 6 7 8 9 10 T” 十。 -5-4-3-2-1 0 1 2 3 4 5 6 7 8 9 10 {+ -5 -4 -3 -2 -1 0 1 2 3 4 5 6 7 8 9 10

Answers: 1


Other questions on the subject: Mathematics
Mathematics, 21.06.2019 12:30, acesangel173
In the diagram below what is the approximate length of the minor arc ab
Answers: 1
Mathematics, 21.06.2019 14:00, lashayreed02
Tracy solved the following problem. which of the statements is true? 9 ÷ 3 + 6 × 2 3 + 6 × 2 9 × 2 18 her answer is correct. her answer is incorrect. she should have multiplied before dividing. her answer is incorrect. she should have multiplied before adding. her answer is incorrect. she should have added before dividing.
Answers: 1
Mathematics, 22.06.2019 03:00, izeahzapata1
An object is accelerating at a constant rate. its velocity in feet per second as a function of time in seconds can be modeled by the linear function v(t) = 2.5t. what does the dependent variable represent for this function? a) acceleration b) distance c) slope d) velocity
Answers: 3
You know the right answer?
Which graph represents the solution set of this inequality? 119 +5< 49 Choose 1 {+ -5 -4 -3 -2 -...
Questions in other subjects:

History, 04.12.2019 22:31

Business, 04.12.2019 22:31
Mathematics, 04.12.2019 22:31


