
Mathematics, 15.04.2021 20:30 anisa9231
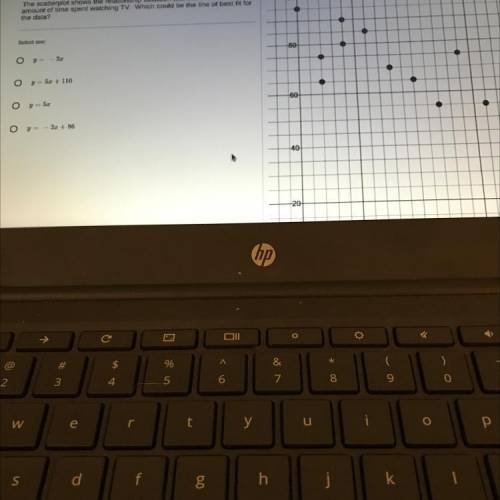
Scatterplot shows the relationship from test scores in the amount of time spent watching TV which could be the line of best fit for the data

Answers: 1


Other questions on the subject: Mathematics
Mathematics, 21.06.2019 15:00, jtingley0502
1. are the triangles similar and if so why? what is the value of x? show your work.
Answers: 2
Mathematics, 21.06.2019 20:30, Gabyngreen
What is the interquartile range of this data set? 2, 5, 9, 11, 18, 30, 42, 48, 55, 73, 81
Answers: 1
Mathematics, 22.06.2019 00:20, sagetpc68741
If your score on your next statistics test is converted to a z score, which of these z scores would you prefer: minus2.00, minus1.00, 0, 1.00, 2.00? why? a. the z score of 2.00 is most preferable because it is 2.00 standard deviations above the mean and would correspond to the highest of the five different possible test scores. b. the z score of 0 is most preferable because it corresponds to a test score equal to the mean. c. the z score of minus2.00 is most preferable because it is 2.00 standard deviations below the mean and would correspond to the highest of the five different possible test scores. d. the z score of minus1.00 is most preferable because it is 1.00 standard deviation below the mean and would correspond to an above average
Answers: 2
You know the right answer?
Scatterplot shows the relationship from test scores in the amount of time spent watching TV which c...
Questions in other subjects:

French, 16.07.2020 20:01

Mathematics, 16.07.2020 20:01

Mathematics, 16.07.2020 20:01
English, 16.07.2020 20:01

Mathematics, 16.07.2020 20:01


