11 Pause
S2 Alg 1 Unit 6 Common Unit Assessment (MC) / 11 of 15
While studying medical
...

Mathematics, 15.04.2021 19:10 hannahkharel2
11 Pause
S2 Alg 1 Unit 6 Common Unit Assessment (MC) / 11 of 15
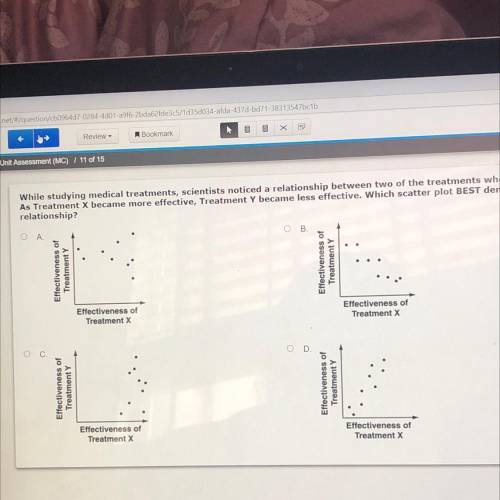
While studying medical
treatments, scientists noticed a relationship between two of the treatments when applied together.
As Treatment X became more effective, Treatment Y became less effective. Which scatter plot BEST demonstrates this
relationship?
В.
Effectiveness o
Treatment Y
Effectiveness
Treatment Y
Effectiveness of
Treatment X
Effectiveness of
Treatment X
Effectiveness of
Treatment
Effectiveness of
Treatment
Effectiveness of
Treatment X
Effectiveness of
Treatment x
I is

Answers: 2


Other questions on the subject: Mathematics
Mathematics, 21.06.2019 17:00, barry14201
What properties allow transformation to be used as a problem solving tool
Answers: 2
Mathematics, 21.06.2019 20:00, haileyhale5
What are the domain and range of the function f(x)=2^x+1
Answers: 1
Mathematics, 21.06.2019 20:00, brittanybyers122
Which type of graph would allow us to compare the median number of teeth for mammals and reptiles easily
Answers: 2
You know the right answer?
Questions in other subjects:
Mathematics, 02.08.2019 18:30
Mathematics, 02.08.2019 18:30

Mathematics, 02.08.2019 18:30

History, 02.08.2019 18:30
Biology, 02.08.2019 18:30

Geography, 02.08.2019 18:30

History, 02.08.2019 18:30


