
Mathematics, 15.04.2021 18:30 alexcuevaz90
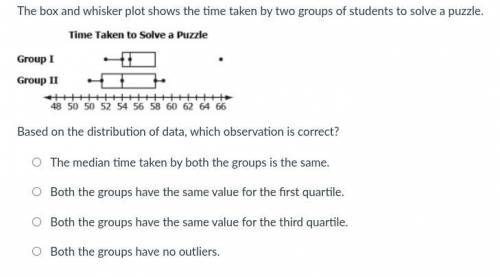
The box and whisker plot shows the time taken by two groups of students to solve a puzzle. Based on the distribution of data, which observation is correct? answer fast

Answers: 1


Other questions on the subject: Mathematics
Mathematics, 21.06.2019 21:20, ladawnrowles005
Drag each expression to the correct location on the solution. not all expressions will be used. consider the polynomial 8x + 2x2 - 20x - 5. factor by grouping to write the polynomial in factored form.
Answers: 1
Mathematics, 22.06.2019 00:30, starfox5454
How many square centimeters of wrapping paper will be used to wrap the shoe box?
Answers: 1
Mathematics, 22.06.2019 03:00, Geo777
When you dilate a figure with a scale factor of 1/2, what will the dilated figure look like? a: the dilated figure will have side lengths that are half the length of the original side lengths. b: the angles in the dilated figure will be half the measure of the original figure. c: the dilated figure will have side lengths twice the length of the original.
Answers: 2
You know the right answer?
The box and whisker plot shows the time taken by two groups of students to solve a puzzle. Based on...
Questions in other subjects:


Computers and Technology, 02.12.2019 20:31


