
Mathematics, 15.04.2021 18:30 aleilyg2005
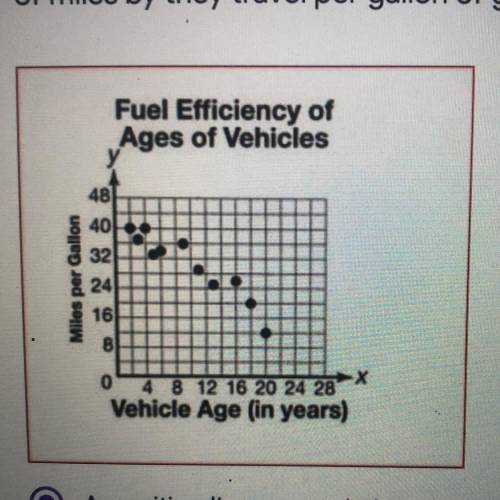
The scatter plot compare the ages of different vehicles and the number of miles by they travel per gallon of gas
A. Positive, linear association
B. Positive, nonlinear association
C. Negative, linear association
D. Negative, nonlinear association

Answers: 2


Other questions on the subject: Mathematics
Mathematics, 21.06.2019 12:50, rntaran2002
Nneeedd 1.find the residual if you know the actual number is 5.2 and the predicted value is 4.8
Answers: 3
Mathematics, 21.06.2019 15:00, asianpatriot7375
The sixth grade art students are making a mosaic using tiles in the shape of right triangles. each tile has leg measures of 3 centimeters and 5 centimeters. i f there are 200 tiles in the mosaic what is the area of the mosaic.
Answers: 1
Mathematics, 21.06.2019 23:30, aherrerasmile1
Scenario: a rectangular plot of ground is 5 meters longer than it is wide. its area is 20,000 square meters. question: what equation will you find the dimensions? note: let w represent the width. options: w(w+5)=20,000 w^2=20,000+5 (w(w+5))/2=20,000 w+2(w+5)=20,000
Answers: 1
Mathematics, 22.06.2019 02:10, Tcareyoliver
Overproduction of uric acid in the body can be an indication of cell breakdown. this may be an advance indication of illness such as gout, leukemia, or lymphoma.† over a period of months, an adult male patient has taken nine blood tests for uric acid. the mean concentration was x = 5.35 mg/dl. the distribution of uric acid in healthy adult males can be assumed to be normal, with σ = 1.87 mg/dl. (a) find a 95% confidence interval for the population mean concentration of uric acid in this patient's blood. what is the margin of error? (round your answers to two decimal places.) lower limit upper limit margin of error (b) what conditions are necessary for your calculations? (select all that apply.) σ is unknown n is large σ is known normal distribution of uric acid uniform distribution of uric acid (c) interpret your results in the context of this problem. there is not enough information to make an interpretation. the probability that this interval contains the true average uric acid level for this patient is 0.05. the probability that this interval contains the true average uric acid level for this patient is 0.95. there is a 95% chance that the confidence interval is one of the intervals containing the population average uric acid level for this patient. there is a 5% chance that the confidence interval is one of the intervals containing the population average uric acid level for this patient. (d) find the sample size necessary for a 95% confidence level with maximal margin of error e = 1.10 for the mean concentration of uric acid in this patient's blood. (round your answer up to the nearest whole number.) blood tests
Answers: 2
You know the right answer?
The scatter plot compare the ages of different vehicles and the number of miles by they travel per g...
Questions in other subjects:

Social Studies, 05.05.2020 14:17

Social Studies, 05.05.2020 14:17


