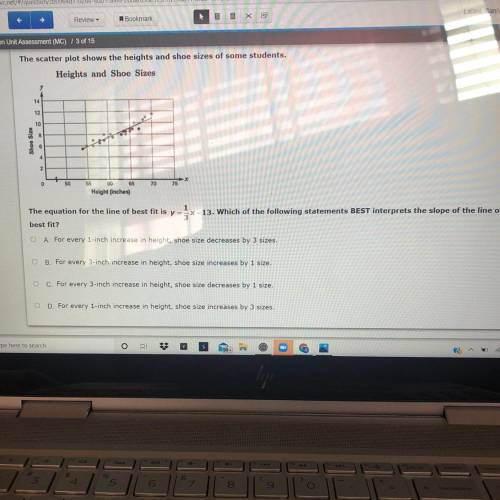
The scatter plot shows the heights and shoe sizes of some students,
Heights and Shoe Slues
14...

Mathematics, 15.04.2021 18:20 kholman
The scatter plot shows the heights and shoe sizes of some students,
Heights and Shoe Slues
14
12
10
TO
76
Height (inches)
The equation for the line of best fitis y *-13. Which of the following statements BEST interprets the slope of the line of
best fit?
A. For every 1-inch increase in height, shoe size decreases by 3 sizes.
OB For every 3 inch increase in height, shoe size increases by 1 size.
OC For every 3-inch increase in height, shoe size decreases by 1 size.
D. For every 1-inch increase in height, shoe size increases by 3 sizes.

Answers: 3


Other questions on the subject: Mathematics
Mathematics, 21.06.2019 20:30, violetagamez2
Answer for 10 points show work you guys in advanced < 3
Answers: 1
Mathematics, 21.06.2019 22:10, 666isabella666
Gravel is being dumped from a conveyor belt at a rate of 25 ft3/min, and its coarseness is such that it forms a pile in the shape of a cone whose base diameter and height are always equal. how fast is the height of the pile increasing when the pile is 14 ft high? (round your answer to two decimal places.) ft/min
Answers: 3
Mathematics, 22.06.2019 01:20, emanuel323
Use pascal's triangle to find the missing values. x4 - 4xb + 6x2 - ax + 1
Answers: 3
Mathematics, 22.06.2019 03:20, charlesmb7985
If a=0.333333 and b=0.55555, what is the value of a+b
Answers: 1
You know the right answer?
Questions in other subjects:

History, 28.05.2020 05:00


Mathematics, 28.05.2020 05:00
Mathematics, 28.05.2020 05:00


