
Mathematics, 14.04.2021 21:30 Yoli1117
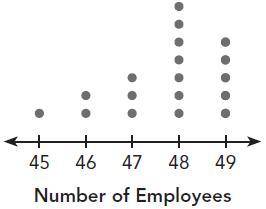
The dot plot shows the number of employees in a group of companies.
Each dot represents 11 company.
Find the mode using the above data dot plot.

Answers: 2


Other questions on the subject: Mathematics
Mathematics, 21.06.2019 15:30, nicpinela1234
The coordinates of a, b, and c in the diagram are a(p,4), b(6,1), and c(9,q). which equation correctly relates p and q? hint: since is perpendicular to , the slope of × the slope of = -1. a. p - q = 7 b. q - p = 7 c. -q - p = 7 d. p + q = 7
Answers: 3
Mathematics, 21.06.2019 16:00, SavyBreyer
Use the function f(x) is graphed below. the graph of the function to find, f(6). -2 -1 1 2
Answers: 1
You know the right answer?
The dot plot shows the number of employees in a group of companies.
Each dot represents 11 company...
Questions in other subjects:
Mathematics, 28.12.2020 18:50


Mathematics, 28.12.2020 18:50
Mathematics, 28.12.2020 18:50

Mathematics, 28.12.2020 18:50


