Find the interquartile range (IQR) of the data in the box plot below.
pencils
Number of penci...

Mathematics, 14.04.2021 20:00 kennycooper3096
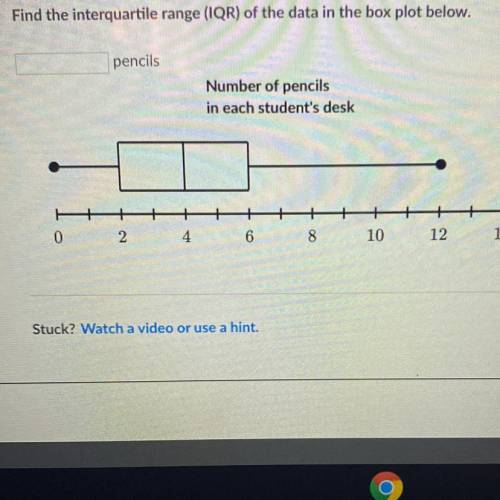
Find the interquartile range (IQR) of the data in the box plot below.
pencils
Number of pencils
in each student's desk
0
2
4
6
8
ca
10
12
14

Answers: 2


Other questions on the subject: Mathematics
Mathematics, 21.06.2019 16:30, sjaybanks4067
Asequence {an} is defined recursively, with a1 = 1, a2 = 2 and, for n > 2, an = an-1 an-2 . find the term a241
Answers: 2
Mathematics, 21.06.2019 20:20, shartman22
20 solve 2(4 x + 3) < 5 x + 21. a) { x | x < 9} b) { x | x > -5} c) { x | x > -9} d) { x | x < 5}
Answers: 2
You know the right answer?
Questions in other subjects:
Mathematics, 16.12.2020 16:20

Mathematics, 16.12.2020 16:20


French, 16.12.2020 16:20


