
Mathematics, 14.04.2021 19:30 madisonrparks
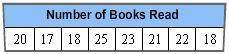
This chart shows the number of books that eight students read last year. Which of the following statements is true about this data set? A. The mean and the median are equal. B. There is no mode. C. The median is 23. D. The mean is 20.

Answers: 1


Other questions on the subject: Mathematics
Mathematics, 21.06.2019 15:30, arringtonlamar
Consider the integral: 4 0 16 − y2 − 16 − y2 4 1 x2 + y2 dz dx dy . (a) describe w. use the standard view of the x, y, and z axes. front half of a cone with a rounded top. full cone with a flat top. right half of a cone with a flat top. front half of a cone with a flat top. right half of a cone with a rounded top.
Answers: 1
Mathematics, 21.06.2019 22:00, erikacastro5404
The point of intersection of the diagonals of a rectangle is 4 cm further away from the smaller side then from the larger side of the rectangle. the perimeter of the rectangle is equal to 56 cm. find the lengths of the sides of the rectangle. 16 points answer quick
Answers: 1
You know the right answer?
This chart shows the number of books that eight students read last year. Which of the following stat...
Questions in other subjects:
Mathematics, 02.07.2019 12:10

History, 02.07.2019 12:10

Biology, 02.07.2019 12:10

English, 02.07.2019 12:10

Spanish, 02.07.2019 12:10

History, 02.07.2019 12:10
Mathematics, 02.07.2019 12:10


