
Mathematics, 14.04.2021 18:20 leannaadrian
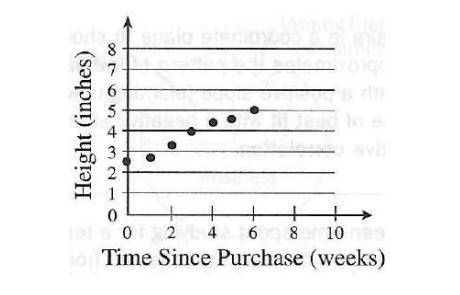
The scatter plot below shows a plant’s height over time. Based on the graph, what is the best prediction for the plant’s height after 10 weeks?
A. 5 inches
B. 5.8 inches
C. 6 inches
D. 7.1 inches

Answers: 1


Other questions on the subject: Mathematics
Mathematics, 21.06.2019 19:00, issaaamiaaa15
You got a job selling magazines door-to-door. you are paid $100 per day plus $1.50 for each magazine you sell. which recursive formula models this situation?
Answers: 1
Mathematics, 21.06.2019 21:20, ladawnrowles005
Drag each expression to the correct location on the solution. not all expressions will be used. consider the polynomial 8x + 2x2 - 20x - 5. factor by grouping to write the polynomial in factored form.
Answers: 1
Mathematics, 21.06.2019 22:00, afolmar2006
What is the solution to the system of equation graphed belowa.(0,-4)b.(2,5),1),-3)
Answers: 3
You know the right answer?
The scatter plot below shows a plant’s height over time. Based on the graph, what is the best predic...
Questions in other subjects:
Mathematics, 11.10.2020 03:01
Mathematics, 11.10.2020 03:01


Biology, 11.10.2020 03:01
Physics, 11.10.2020 03:01


Geography, 11.10.2020 03:01


