
Mathematics, 14.04.2021 08:50 Aguzman07
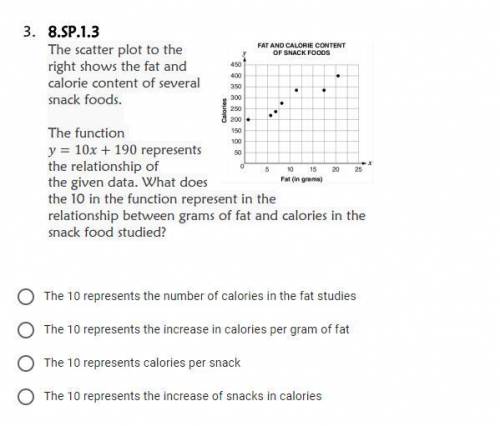
The scatter plot to the right shows the fat and calorie content of several snack foods. The function y = 10x + 190 represents the relationship of the given data. What does the 10 in the function represent in the relationship between grams of fat and calories in the snack food studied?

Answers: 2


Other questions on the subject: Mathematics
Mathematics, 21.06.2019 17:10, payshencec21
The number of chocolate chips in an 18-ounce bag of chocolate chip cookies is approximately normally distributed with a mean of 1252 chips and standard deviation 129 chips. (a) what is the probability that a randomly selected bag contains between 1100 and 1500 chocolate chips, inclusive? (b) what is the probability that a randomly selected bag contains fewer than 1125 chocolate chips? (c) what proportion of bags contains more than 1225 chocolate chips? (d) what is the percentile rank of a bag that contains 1425 chocolate chips?
Answers: 1
Mathematics, 22.06.2019 01:00, cldantesBanana
What is the y-intercept of the line with the equation 3x + 4y = 12?
Answers: 1
You know the right answer?
The scatter plot to the right shows the fat and calorie content of several snack foods. The function...
Questions in other subjects:


Mathematics, 02.03.2021 21:40


