
Mathematics, 14.04.2021 01:00 moore7165
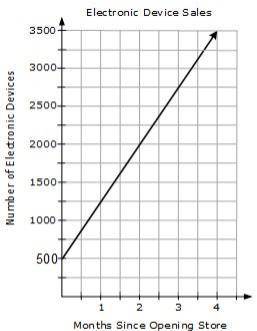
After selling 500 electronic devices online, Theodore decided to open a store to sell electronic devices to in-store customers as well as online customers. The graph below shows Theodore’s online and in store electronic device sales according to the number of month since opening the store.
Which statement is true about the relationship of the data displayed in the graph?
Group of answer choices
The data in the graph represents a linear proportional relationship because the constant of proportionality is 750 units per month and has a y-intercept of (0, 500).
The data in the graph represents a linear proportional relationship because the data forms a straight line and does not include the ordered pair (0,0).
The data represents a linear non-proportional relationship because the data forms a straight line with the constant rate of change of 750 units per month and the graph does not include the ordered pair (0, 0).
The data represents a linear non-proportional relationship because the data forms a straight line with a constant rate of change of 500 units per month and the graph does not include the ordered pair (0, 0).

Answers: 1


Other questions on the subject: Mathematics
Mathematics, 21.06.2019 20:30, lcy1086526Lisa1026
25) 56(1) = 5b a. identity property of addition b. identity property of multiplication c. commutative property of multiplication d. commutative property of addition
Answers: 1
Mathematics, 21.06.2019 21:20, andybiersack154
52 cm radius = diameter = area = circumference = circumfer
Answers: 1
You know the right answer?
After selling 500 electronic devices online, Theodore decided to open a store to sell electronic dev...
Questions in other subjects:

Biology, 21.06.2021 20:50


History, 21.06.2021 20:50
Spanish, 21.06.2021 20:50
Mathematics, 21.06.2021 20:50

Physics, 21.06.2021 20:50
History, 21.06.2021 20:50


