
Mathematics, 13.04.2021 20:10 6011028
NEED HELP ASAP! WILL CRY OR SOMETHING
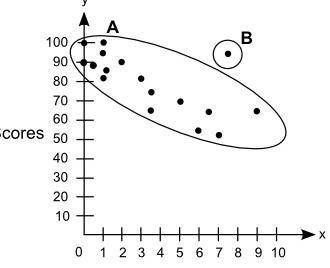
The scatter plot shows the relationship between the test scores of a group of students and the number of hours they play computer games in a week:
On a grid, Label Hours Playing Computer Games on x axis and Test Scores on y axis. The title of the graph is Test Scores and Computer Games. The scale on the x axis shows the numbers from 0 to 10 at increments of 1, and the scale on the y axis shows numbers from 0 to 100 at increments of 10. Dots are made at the ordered pairs 0, 90 and 0, 100 and 0.5, 89 and 1, 81 and 1, 95 and 1, 100 and 1.1, 85 and 2, 90 and 3, 81 and 3.5, 65 and 3.5, 75 and 5, 70 and 6, 55 and 6.5, 65 and 7, 52 and 7.5, 95 and 9, 65. The ordered pair 7.5, 95 is circled and labeled as B. All the other points are put in an oval and labeled as A.
Part A: What is the group of points labeled A called? What is the point labeled B called? Give a possible reason for the presence of point B. (5 points)
Part B: Describe the association between students' test scores and the number of hours they play computer games. (5 points)

Answers: 3


Other questions on the subject: Mathematics
Mathematics, 21.06.2019 15:30, jdisalle7486
Franco wants to double the volume of the cone. what should he do?
Answers: 2
Mathematics, 21.06.2019 20:00, alondrahernande3
Which sums are equal to 1hold 6/8? choose all answers that are correcta.1/8+6/8b.12/8+2/8c.8/8+1/8 +1/8+1/8+1/8+1/8+1/8d.8/8+6/8
Answers: 1
You know the right answer?
NEED HELP ASAP! WILL CRY OR SOMETHING
The scatter plot shows the relationship between the test sc...
Questions in other subjects:

History, 24.03.2020 00:04


English, 24.03.2020 00:04


Mathematics, 24.03.2020 00:04


