
Mathematics, 13.04.2021 16:40 mildred3645
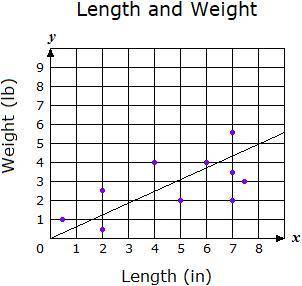
The scatter plot and a line of best fit show the relationship between the length and width of 10 small animals a biologist finds in a park. Which statement describes the relationship between length and weight of the small animals?
A. The length decreased when the weight increased.
B. There was an eight pound increase in weight for every five inch increase in length.
C. A weight of more than five pounds was from an animal less than four inches long.
D. There was a five pound increase in weight for every eight inch increase in length.

Answers: 2


Other questions on the subject: Mathematics
Mathematics, 21.06.2019 13:20, Svetakotok
Which of the following is the rational exponent expression of 6 root f
Answers: 1
You know the right answer?
The scatter plot and a line of best fit show the relationship between the length and width of 10 sma...
Questions in other subjects:

Chemistry, 27.08.2019 09:00

History, 27.08.2019 09:00
Mathematics, 27.08.2019 09:00


Social Studies, 27.08.2019 09:00
Mathematics, 27.08.2019 09:00
Biology, 27.08.2019 09:10


