1 point
8. The dot plot below represents the number of dollars in allowance that
students rec...

Mathematics, 13.04.2021 03:00 sherman55
1 point
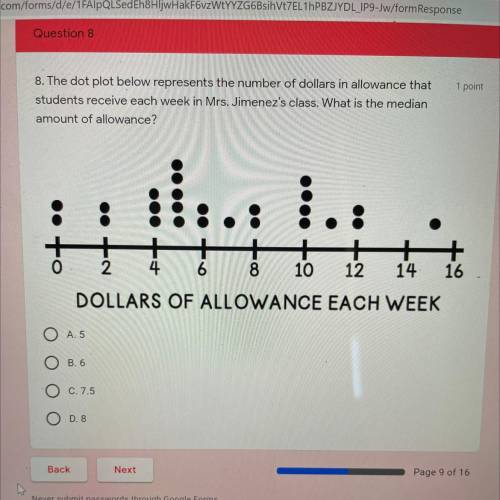
8. The dot plot below represents the number of dollars in allowance that
students receive each week in Mrs. Jimenez's class. What is the median
amount of allowance?
1...
+
2
+
4
+
12
+
14.
O
6
8
10
16
DOLLARS OF ALLOWANCE EACH WEEK

Answers: 1


Other questions on the subject: Mathematics
Mathematics, 22.06.2019 01:30, 20jacksone
Given a binomial distribution variable with n=20 and p=0.60 find the following possibilities using the binomial table a) p(x < 13) b) p x > 15) c) p(x = 17) d) p(11 < x < 14) e) p(11 < x < 14)
Answers: 3
Mathematics, 22.06.2019 02:30, 11needhelp11
Fred and gene are hang gliding. fred is 700 feet above the ground and descending at 15 ft/s. gene is decending as shown in the table. interpret the rates of change and initial values of the linear functions in terms of the situations they model. show all work. freds equation is f(x)=-15x+700. ( genes is the table attached)
Answers: 1
You know the right answer?
Questions in other subjects:

Social Studies, 10.05.2021 03:50
Mathematics, 10.05.2021 03:50


Mathematics, 10.05.2021 03:50
Mathematics, 10.05.2021 03:50


