
Mathematics, 12.04.2021 23:20 lesly0913
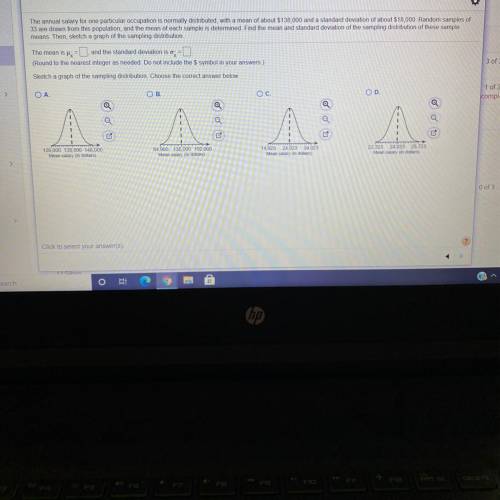
The annual salary for one particular occupation is normally distributed, with a mean of about $138,000 and a standard deviation of about $18,000. Random samples of 33 are drawn from this population, and the mean of each sample is determined. Find the mean and standard deviation of the sampling distribution of these sample means. Then, sketch a graph of the sampling distribution.

Answers: 2


Other questions on the subject: Mathematics
Mathematics, 21.06.2019 15:40, aaliyahmaile13
Yo y do yall have 2 stars that means yall wrong bro
Answers: 1
Mathematics, 21.06.2019 16:30, angie07253
Amuffin recipe, which yields 12 muffins, calls for cup of milk for every 1 cups of flour. the same recipe calls for cup of coconut for every cup of chopped apple. to yield a batch of 30 muffins, how much flour will be needed in the mix?
Answers: 1
Mathematics, 21.06.2019 18:00, cashhd1212
The given dot plot represents the average daily temperatures, in degrees fahrenheit, recorded in a town during the first 15 days of september. if the dot plot is converted to a box plot, the first quartile would be drawn at __ , and the third quartile would be drawn at __ link to graph: .
Answers: 1
Mathematics, 21.06.2019 18:30, jeffreyaxtell4542
10% of 1,900,000. show me how you got the answer
Answers: 2
You know the right answer?
The annual salary for one particular occupation is normally distributed, with a mean of about $138,0...
Questions in other subjects:

Computers and Technology, 18.12.2020 08:40

History, 18.12.2020 08:40

Biology, 18.12.2020 08:40
History, 18.12.2020 08:40

Mathematics, 18.12.2020 08:40


