
Mathematics, 12.04.2021 21:50 debramknoxx
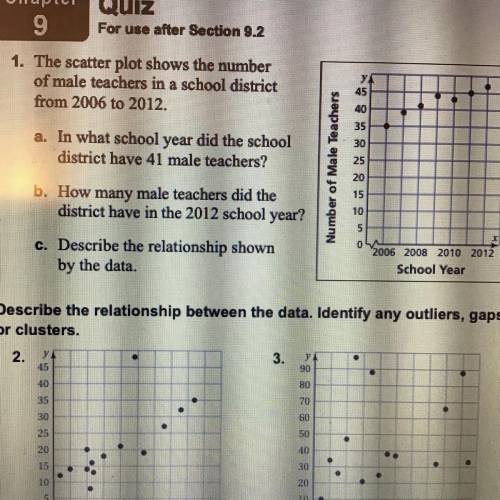
1. The scatterplot shows the number of male teachers in a school district from 2006 to 2012.
a. In what school year did the school district have 41 male teachers?
b. How many male teachers did the district have in the 2012 school year?
c. Describe the relationship shown by the data.

Answers: 1


Other questions on the subject: Mathematics
Mathematics, 21.06.2019 20:00, ayoismeisalex
He weights of 2-pound bags of best dog food are approximately normally distributed with a given mean and standard deviation according to the empirical rule, what percentage of the bags will have weights within 3 standard deviations of the mean? 47.5%68%95%99.7%
Answers: 3
Mathematics, 21.06.2019 21:30, anaemigarcia
What is the solution to this system of equations? y= 2x - 3.5 x - 2y = -14
Answers: 2
Mathematics, 21.06.2019 22:00, gamallopatty
If i had 1234 apples and 1 banana what is the total amount
Answers: 2
Mathematics, 22.06.2019 01:30, germaine88
Recall that two angles are complementary if the sum of their measures is? 90°. find the measures of two complementary angles if one angle is twenty dash nine times the other angle.
Answers: 2
You know the right answer?
1. The scatterplot shows the number of male teachers in a school district from 2006 to 2012.
a. In...
Questions in other subjects:

History, 19.05.2020 20:05
Mathematics, 19.05.2020 20:05
Mathematics, 19.05.2020 20:05


