
Mathematics, 12.04.2021 20:00 soccerjessie8701
SOMEBODY PLZ ANSWER!
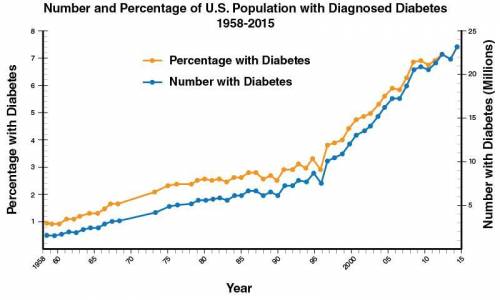
This graph is from a publication of the Centers for Disease Control and Prevention (2017). The y-axis shows the percentage living with diabetes.
The Board of Directors of a medical school wants to use the trend to predict the percentage in 2020 so that they can help train enough doctors to handle the growing numbers. Use a visual estimate of the line of best fit to make a prediction. Do you think your estimated line of best fit will be accurate? Explain why or why not.

Answers: 1


Other questions on the subject: Mathematics
Mathematics, 21.06.2019 13:20, jessicascott120305
If f(x)=2x+2and g(x)=x^3, what is (g•f)(2)
Answers: 1
Mathematics, 21.06.2019 23:10, ineedhelp2285
The input to the function is x and the output is y. write the function such that x can be a vector (use element-by-element operations). a) use the function to calculate y(-1.5) and y(5). b) use the function to make a plot of the function y(x) for -2 ≤ x ≤ 6.
Answers: 1
Mathematics, 21.06.2019 23:30, youngboymark123
Kristen is wrapping presents for the holidays. she has a box that measures 4 ft. x 2 ft. x 2 ft. how many square feet of wrapping paper does she need to cover the box without overlapping?
Answers: 1
You know the right answer?
SOMEBODY PLZ ANSWER!
This graph is from a publication of the Centers for Disease Control and Preven...
Questions in other subjects:

Biology, 27.01.2020 18:31
Mathematics, 27.01.2020 18:31
Mathematics, 27.01.2020 18:31
Mathematics, 27.01.2020 18:31
Mathematics, 27.01.2020 18:31

History, 27.01.2020 18:31
Mathematics, 27.01.2020 18:31
History, 27.01.2020 18:31


