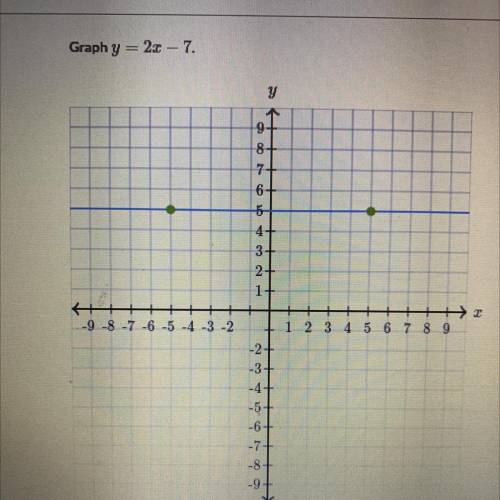
Graph y = 2.3 - 7.
y
→
AU
8+
7+
6+
5
CO
3+
2+...

Mathematics, 11.04.2021 22:00 justinrojo621
Graph y = 2.3 - 7.
y
→
AU
8+
7+
6+
5
CO
3+
2+
1+
MY
-9-8-7 -6 -5 4 -3 -2
1 2 3 4 5 6 7 8 9
Cou
-3
SA
-5-
-6-
-7-
-8
MY
Pra

Answers: 3


Other questions on the subject: Mathematics
Mathematics, 21.06.2019 18:00, evarod
The given dot plot represents the average daily temperatures, in degrees fahrenheit, recorded in a town during the first 15 days of september. if the dot plot is converted to a box plot, the first quartile would be drawn at __ , and the third quartile would be drawn at link to the chart is here
Answers: 1
You know the right answer?
Questions in other subjects:

Mathematics, 06.01.2020 18:31


Computers and Technology, 06.01.2020 18:31


