
Mathematics, 11.04.2021 18:20 Jadiahd
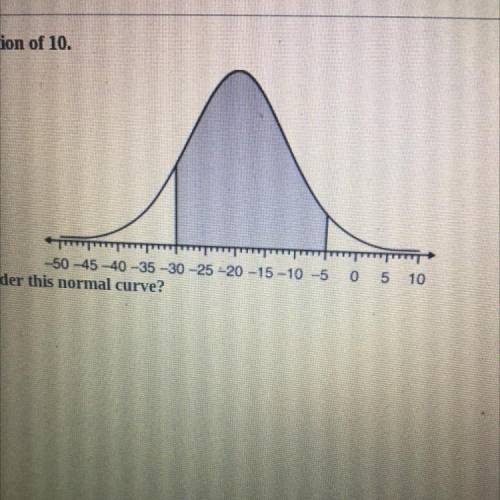
The graph shows a normal distribution with a standard deviation of 10.
Which percentage is the best estimate for the shaded area under the normal curve?
A. 42%
B. 77.5%
C. 79%
D. 83.5%

Answers: 1


Other questions on the subject: Mathematics
Mathematics, 21.06.2019 13:00, jay0630
The graph shows the prices of different numbers of bushels of corn at a store in the current year. the table shows the prices of different numbers of bushels of corn at the same store in the previous year. previous year number of bushels price of corn (dollars) 2 10 4 20 6 30 8 40 part a: describe in words how you can find the rate of change of a bushel of corn in the current year, and find the value. part b: how many dollars more is the price of a bushel of corn in the current year than the price of a bushel of corn in the previous year? show your work.
Answers: 1
Mathematics, 21.06.2019 21:30, jtorres0520
Suppose that sahil knows that 45 people with ages of 18 to 29 voted. without using a calculator, he quickly says then 135 people with ages of 30to 49 voted. is he correct? how might sohil have come up with his answer so quickly?
Answers: 3
Mathematics, 22.06.2019 00:30, steelersfan4343
Which of these side lengths could form a triangle a) 2 cm , 2 cm , 4 cm b) 3 cm , 5 cm , 10 cm c) 3 cm , 4 cm , 5 cm d) 4 cm , 8 cm , 15 cm
Answers: 3
You know the right answer?
The graph shows a normal distribution with a standard deviation of 10.
Which percentage is the best...
Questions in other subjects:
Mathematics, 18.07.2019 16:00

Geography, 18.07.2019 16:00

Health, 18.07.2019 16:00

English, 18.07.2019 16:00

Computers and Technology, 18.07.2019 16:00
Mathematics, 18.07.2019 16:00
Mathematics, 18.07.2019 16:00

Biology, 18.07.2019 16:00
Biology, 18.07.2019 16:00


