
Mathematics, 11.04.2021 17:20 axleon11
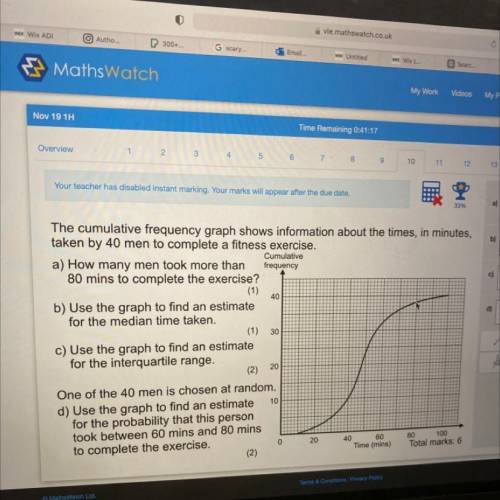
The cumulative frequency graph shows information about the times, in minutes,
taken by 40 men to complete a fitness exercise.
Cumulative
a) How many men took more than frequency
80 mins to complete the exercise?
(1)
40
b) Use the graph to find an estimate
for the median time taken.
(1)
c) Use the graph to find an estimate
for the interquartile range.
(2)
30
20
10
One of the 40 men is chosen at random.
d) Use the graph to find an estimate
for the probability that this person
took between 60 mins and 80 mins
to complete the exercise.
0
(2)
20
40 60
Time (mins)
80 100
Total marks: 6

Answers: 1


Other questions on the subject: Mathematics
Mathematics, 22.06.2019 00:30, aylineorozco836
If m_b=mzd= 43, find mzc so that quadrilateral abcd is a parallelogram o 86 137 o 129 43 description
Answers: 1
Mathematics, 22.06.2019 01:40, savthespice
Manuela solved the equation below. what is the solution to manuela’s equation?
Answers: 2
You know the right answer?
The cumulative frequency graph shows information about the times, in minutes,
taken by 40 men to co...
Questions in other subjects:

Biology, 23.09.2019 10:00


Business, 23.09.2019 10:00
Mathematics, 23.09.2019 10:00
Mathematics, 23.09.2019 10:00

Social Studies, 23.09.2019 10:00


