
Mathematics, 11.04.2021 04:50 lohggg
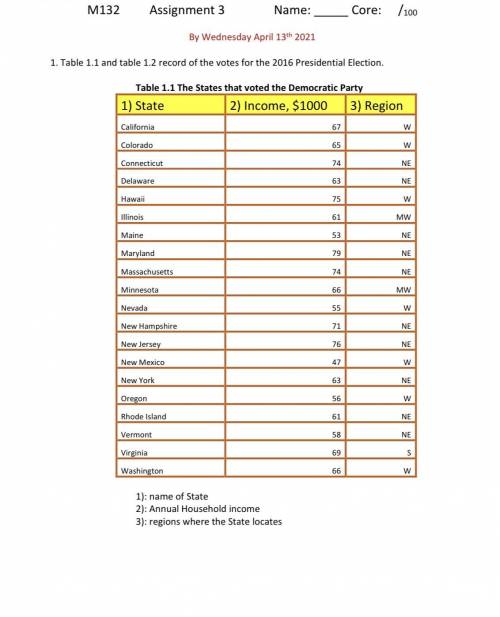
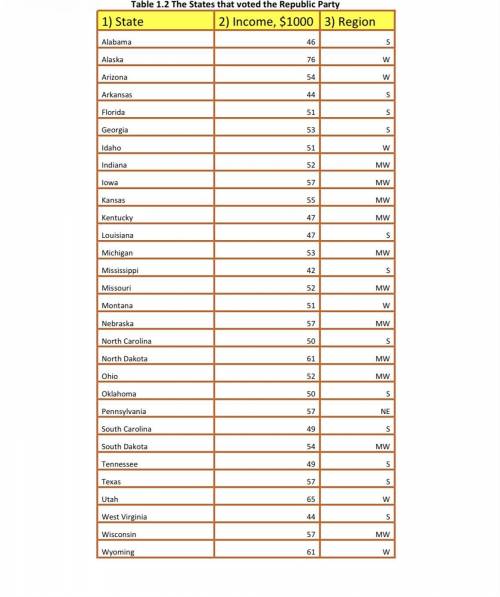
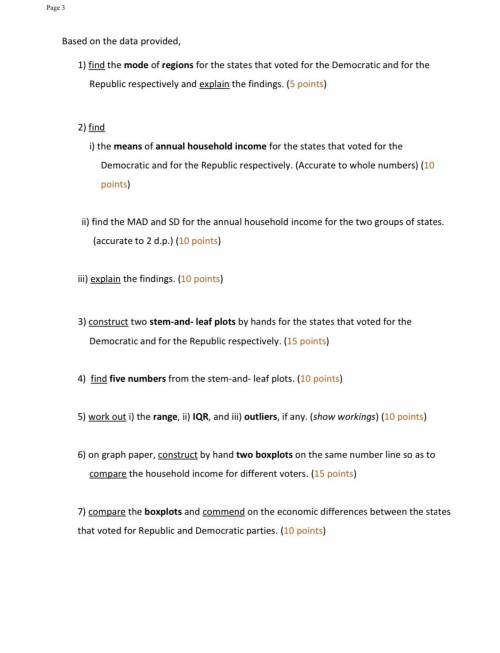
Based on the data provided in the picture,
1) find the mode of regions for the states that voted for the Democratic and for the Republic respectively and explain the findings.
2) find
i) the means of annual household income for the states that voted for the Democratic and for the Republic respectively. (Accurate to whole numbers) (10 points)
ii) find the MAD and SD for the annual household income for the two groups of states. (accurate to 2 d. p.) (10 points)
iii) explain the findings. (10 points)
3) construct two stem-and- leaf plots by hands for the states that voted for the Democratic and for the Republic respectively. (15 points)
4) find five numbers from the stem-and- leaf plots. (10 points)
5) work out i) the range, ii) IQR, and iii) outliers, if any. (show workings) (10 points)
6) on graph paper, construct by hand two boxplots on the same number line so as to compare the household income for different voters. (15 points)
7) compare the boxplots and commend on the economic differences between the states that voted for Republic and Democratic parties. (10 points)
2. Three cars are driving on a racetrack. The mean speed of the three cars is 100 miles per hour. Car X drives 109 miles per hour and Car Y drives 111miles per hour. Use the mean to estimate the speed of Car Z. Then find the actual speed of Car Z. (show workings).

Answers: 1


Other questions on the subject: Mathematics
Mathematics, 21.06.2019 17:30, kirsten8605
If the measure of angle 1 is 110 degrees and the measure of angle 3 is (2 x+10 degree), what is the value of x?
Answers: 2
Mathematics, 21.06.2019 18:00, stephanielynch
Last year, a state university received 3,560 applications from boys. of those applications, 35 percent were from boys who lived in other states. part a)how many applications did the university receive from boys who lived in other states? part b)applications to the university from boys represented 40percent of all applications. how many applications did the university receive in all? i don't how to do part b so me and plz tell how you got your answer
Answers: 1
You know the right answer?
Based on the data provided in the picture,
1) find the mode of regions for the states that voted fo...
Questions in other subjects:
Mathematics, 19.05.2021 18:10

Mathematics, 19.05.2021 18:10

History, 19.05.2021 18:10
History, 19.05.2021 18:10
Mathematics, 19.05.2021 18:10


