
Mathematics, 11.04.2021 03:50 madbiebzz
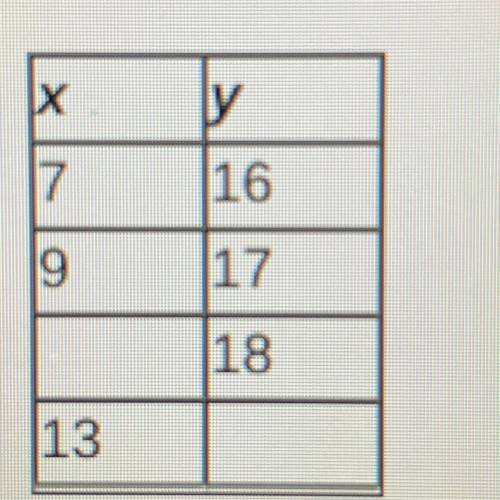
Determine any data values that are missing from the table, assuming that the data represent a linear function.
X Y
7 16
9 17
18
13
a Missing x:13
Missing y:20
b. Missing x:13
Missing y.19
C. Missing x:11
Missing y:20
d. Missing x:11
Missing y:19

Answers: 1


Other questions on the subject: Mathematics
Mathematics, 21.06.2019 18:00, cashhd1212
The given dot plot represents the average daily temperatures, in degrees fahrenheit, recorded in a town during the first 15 days of september. if the dot plot is converted to a box plot, the first quartile would be drawn at __ , and the third quartile would be drawn at __ link to graph: .
Answers: 1
Mathematics, 21.06.2019 20:00, anabelleacunamu
Find the value of x. round the length to the nearest tenth
Answers: 1
Mathematics, 21.06.2019 23:00, freebyyy7032
Unaware that 35% of the 10000 voters in his constituency support him, a politician decides to estimate his political strength. a sample of 200 voters shows that 40% support him. a. what is the population? b. what is the parameter of interest? state its value c. what is the statistics of the interest? state its value d. compare your answers in (b) and (c) is it surprising they are different? if the politician were to sample another 200 voters, which of the two numbers would most likely change? explain
Answers: 2
Mathematics, 21.06.2019 23:00, sandyrose3012
Multiplying fractions by whole number 5 x 1/3=?
Answers: 2
You know the right answer?
Determine any data values that are missing from the table, assuming that the data represent a linear...
Questions in other subjects:

Biology, 23.06.2020 15:01

History, 23.06.2020 15:01
Mathematics, 23.06.2020 15:01
Mathematics, 23.06.2020 15:01


Health, 23.06.2020 15:01


