Given:
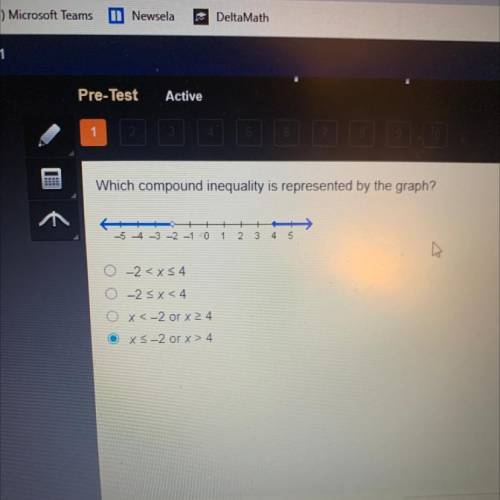
The graph of a compound inequality is given.
To find:
The compound inequality.
Solution:
From the given graph it is clear that an arrow approaches towards left from  and there is an open circle at .
It means all the values less than  are included in the solution set but is not included.
 ...(i)
An arrow approaches towards right from  and there is a closed circle at .
It means all the values greater than of equal to 4 are included in the solution set and is also included.
 ...(ii)
Using (i) and (ii), we get the compound inequality.
or
Therefore, the correct option is C.