
Mathematics, 10.04.2021 05:40 jack487
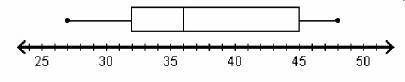
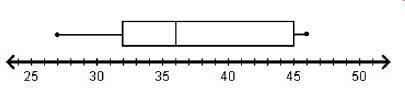
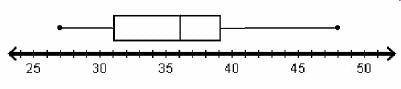
Which box plot correctly displays the data set with a maximum of 48, a minimum of 27, a median of 36, an upper quartile of 45, and a lower quartile of 32? (please refer to the answer like this: Image [number])


Answers: 2


Other questions on the subject: Mathematics
Mathematics, 21.06.2019 17:00, jaejaeJae9534
Rectangle leg this 11feet and perimeter of 38feet what is the width of the rectangle in feet
Answers: 1
Mathematics, 21.06.2019 18:30, george6871
Abus travels 36 miles in 45 minutes. enter the number of miles the bus travels in 60 minutes at this rate.
Answers: 2
Mathematics, 21.06.2019 19:00, datands
Acompany that manufactures and sells guitars made changes in their product range. from the start they had 20 models. then they reduced the number of models to 15. as a result, the company enjoyed a 10% increase in turnover. - how much did the stock level change? in (%)
Answers: 2
You know the right answer?
Which box plot correctly displays the data set with a maximum of 48, a minimum of 27, a median of 36...
Questions in other subjects:

Mathematics, 21.12.2020 21:50
Mathematics, 21.12.2020 21:50


History, 21.12.2020 21:50
Mathematics, 21.12.2020 21:50
Mathematics, 21.12.2020 21:50

Spanish, 21.12.2020 21:50


