4. Which graph shows the lowest score on the test?
A both graphs
B only the stem-and-leaf plot...

Mathematics, 09.04.2021 19:50 ErrorNameTaken505
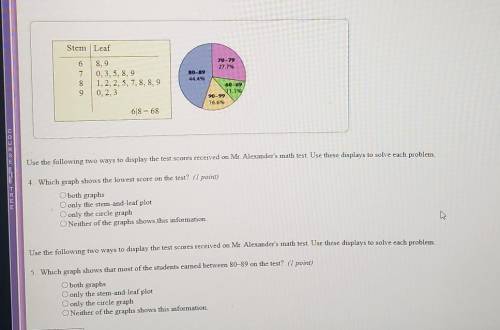
4. Which graph shows the lowest score on the test?
A both graphs
B only the stem-and-leaf plot
C only the circle graph
D Neither of the graphs shows this information
can you please answer the other question in the pic

Answers: 3


Other questions on the subject: Mathematics
You know the right answer?
Questions in other subjects:


Mathematics, 04.11.2020 01:00
Mathematics, 04.11.2020 01:00


Chemistry, 04.11.2020 01:00
Biology, 04.11.2020 01:00


