The graph of y = f(x) is shown on the grid.
a) On the grid, draw the graph with equation
y =...

Mathematics, 09.04.2021 15:50 amcdonald009
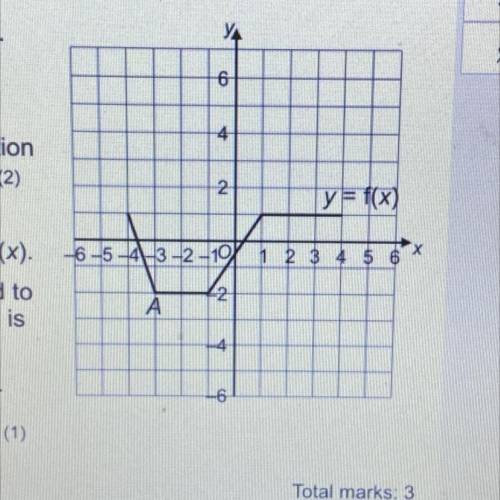
The graph of y = f(x) is shown on the grid.
a) On the grid, draw the graph with equation
y = f(x - 1) + 4.
Point A (-3,-2) lies on the graph of y = f(x).
When the graph of y = f(x) is transformed to
the graph with equation y = f(-x), point A is
mapped to point B.
b) Write down the coordinates of point B.

Answers: 1


Other questions on the subject: Mathematics
Mathematics, 21.06.2019 16:50, thegoat3180
The lines shown below are parallel. if the green line has a slope of -1, what is the slope of the red line?
Answers: 1
Mathematics, 21.06.2019 18:40, TheLuciferOG4558
Acircle has a circumference of 28.36 units what is the diameter of the circle
Answers: 2
Mathematics, 21.06.2019 19:00, SakChan8367
Ab based on the given diagram, if m_1 = 60° then m 2 = 30 60 90 180
Answers: 1
You know the right answer?
Questions in other subjects:

History, 09.12.2020 07:50


Business, 09.12.2020 07:50
History, 09.12.2020 07:50
Mathematics, 09.12.2020 07:50


Mathematics, 09.12.2020 07:50


