
Mathematics, 09.04.2021 15:30 ondray3435
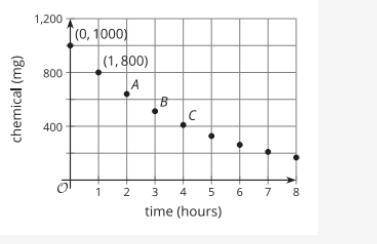
The graph shows the amount of a chemical in a water sample. It is decreasing exponentially. What is the y-coordinate of point A? What is the y-coordinate of point B? What is the y-coordinate of point C? Do not round.

Answers: 1


Other questions on the subject: Mathematics
Mathematics, 21.06.2019 19:30, dbenjamintheflash5
You have 17 cats that live in houses on your street, 24 dogs, 3 fish, and 4 hamsters. what percent of animals on your block are dogs?
Answers: 2
Mathematics, 21.06.2019 22:30, muziqbox594
What is the name of a polygon that has four congruent sides and theses angle measures 60,120,60,120?
Answers: 1
Mathematics, 21.06.2019 22:40, michaellagann2020
Adeli owner keeps track of the to-go orders each day. the results from last saturday are shown in the given two-way frequency table. saturday's to-go deli orders in person by phone online total pick up 38 25 31 94 delivery 35 28 34 97 total 73 53 65 191 what percent of the to-go orders were delivery orders placed by phone? a. 14.66% b. 38.41% c. 28.87% d. 52.83%
Answers: 2
Mathematics, 22.06.2019 00:30, nataliemoore1974
Olivia is using 160 quilt squares to make a red, yellow, and blue quilt if 25% of the quilt are red and 30% are yellow how many quilt squares are blue
Answers: 3
You know the right answer?
The graph shows the amount of a chemical in a water sample. It is decreasing exponentially. What is...
Questions in other subjects:


Chemistry, 18.03.2021 03:20
Mathematics, 18.03.2021 03:20
Mathematics, 18.03.2021 03:20

History, 18.03.2021 03:20

Geography, 18.03.2021 03:20
Mathematics, 18.03.2021 03:20


