Here is the histogram of a data distribution.
5 4 3 2
1'2'34'5'6'7'8'9 '10
Which best d...

Mathematics, 08.04.2021 18:40 mollywolly99
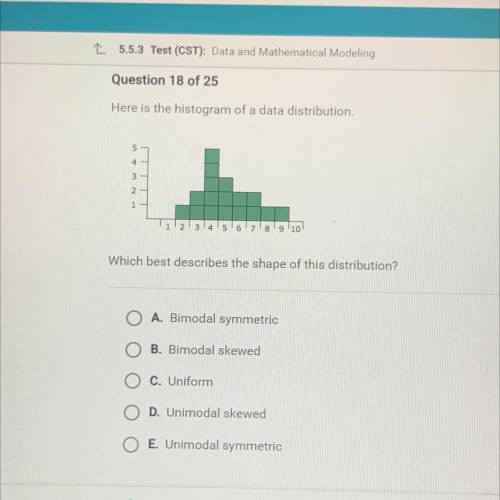
Here is the histogram of a data distribution.
5 4 3 2
1'2'34'5'6'7'8'9 '10
Which best describes the shape of this distribution?
O A. Bimodal symmetric
B. Bimodal skewed
O c. Uniform
O D. Unimodal skewed
O E. Unimodal symmetric

Answers: 3


Other questions on the subject: Mathematics
Mathematics, 21.06.2019 22:30, ondreabyes225pcr83r
Adistribution has the five-number summary shown below. what is the third quartile, q3, of this distribution? 22, 34, 41, 55, 62
Answers: 2
Mathematics, 21.06.2019 23:30, pennygillbert
The area (a) of a circle with a radius of r is given by the formula and its diameter (d) is given by d=2r. arrange the equations in the correct sequence to rewrite the formula for diameter in terms of the area of the circle.
Answers: 1
You know the right answer?
Questions in other subjects:

History, 22.04.2021 20:50
Mathematics, 22.04.2021 20:50
Mathematics, 22.04.2021 20:50
Mathematics, 22.04.2021 20:50


Computers and Technology, 22.04.2021 20:50

Biology, 22.04.2021 20:50


