
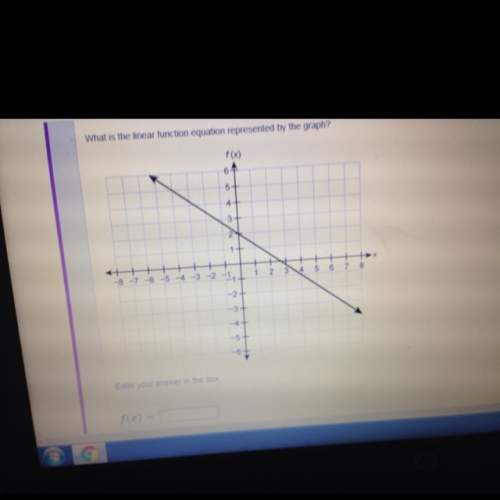
Mathematics, 07.04.2021 23:20 kh3791
The following dot plots show the amount of time it takes each person, in a random sample, to complete two similar problems. What is the mean time for each problem? Make a comparative inference based on the mean values. The mean time for Problem 1 is ___ minutes.


Answers: 2


Other questions on the subject: Mathematics
Mathematics, 21.06.2019 20:30, destinyharris8502
I’m on question 7 it says a covered water tank is in the shape of a cylinder the tank has a 28 inch diameter and a height of 66 inches to the nearest square inch what is the surface area of the water tank
Answers: 2
Mathematics, 21.06.2019 22:00, prishnasharma34
The two box p digram the two box plots show the data of the pitches thrown by two pitchers throughout the season. which statement is correct? check all that apply. pitcher 1 has a symmetric data set. pitcher 1 does not have a symmetric data set. pitcher 2 has a symmetric data set. pitcher 2 does not have a symmetric data set. pitcher 2 has the greater variation. ots represent the total number of touchdowns two quarterbacks threw in 10 seasons of play
Answers: 1
Mathematics, 22.06.2019 00:00, genyjoannerubiera
Iwill arward ! , i if bt ≅ eu , bu ≅ et , prove: ∠b ≅ ∠e. fill in the blanks: draw segment ut ≅ bt≅ bu ≅ △ubt ≅ △
Answers: 1
You know the right answer?
The following dot plots show the amount of time it takes each person, in a random sample, to complet...
Questions in other subjects:


Computers and Technology, 20.10.2020 03:01

Business, 20.10.2020 03:01


